Adp-Dependent Glucokinase
(All numbering and residues are taken from first PDB file)
![]()
![]()
Bending Residue Dihedral Analysis
Residue
iResidue
i+1Distance of hinge axis to residue i in
(A) Distance of hinge axis to residue i in
(A) Change in
(deg) Change in
(deg) Angle of psi(i) axis to hinge axis
(deg) Angle of psi(i) axis to hinge axis
(deg) Percentage Progress
THR-39
ASN-40
1.1
1.7
-5.2
7.4
79.7
81.0
7.9
ASN-40
ILE-41
2.7
2.6
-10.4
1.8
146.7
148.4
-30.4
ILE-41
ASP-42
5.6
5.2
-15.2
17.3
115.5
111.2
19.1
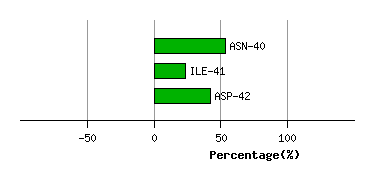
Graph shows rotational transition at bending residues and can be used
to identify hinge bending residues.
Probably only informative for interdomain rotations greater than 20 degrees
Residue
iResidue
i+1Distance of hinge axis to residue i in
(A) Distance of hinge axis to residue i in
(A) Change in
(deg) Change in
(deg) Angle of psi(i) axis to hinge axis
(deg) Angle of psi(i) axis to hinge axis
(deg) Percentage Progress
ARG-117
ILE-118
5.2
4.7
8.2
-5.9
30.8
33.6
3.4
ILE-118
GLY-119
2.9
1.9
-16.2
-3.2
95.3
98.6
9.8
GLY-119
GLY-120
2.3
2.8
-17.1
15.6
123.7
132.4
10.7
GLY-120
GLN-121
3.2
4.6
4.1
7.8
125.6
114.4
-26.6
GLN-121
ALA-122
6.0
7.2
-17.1
7.9
92.0
92.4
22.0
ALA-122
GLY-123
5.9
6.6
-2.3
-1.0
57.5
55.7
15.4
GLY-123
ILE-124
3.2
3.7
3.8
-6.8
171.7
171.3
15.8
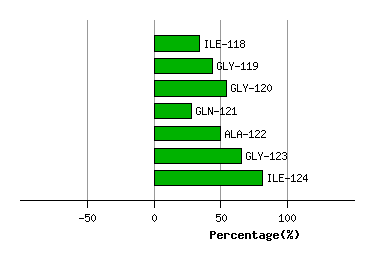
Graph shows rotational transition at bending residues and can be used
to identify hinge bending residues.
Probably only informative for interdomain rotations greater than 20 degrees
Residue
iResidue
i+1Distance of hinge axis to residue i in
(A) Distance of hinge axis to residue i in
(A) Change in
(deg) Change in
(deg) Angle of psi(i) axis to hinge axis
(deg) Angle of psi(i) axis to hinge axis
(deg) Percentage Progress
LEU-182
ILE-183
7.0
6.7
16.7
0.1
22.2
28.2
79.4
ILE-183
HIS-184
8.9
8.8
1.6
-9.6
81.0
86.2
-16.4
HIS-184
TYR-185
9.4
9.5
19.5
-10.7
34.7
30.8
34.0
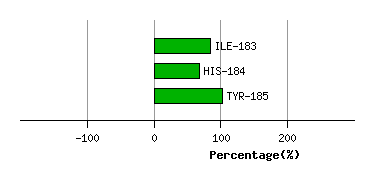
Graph shows rotational transition at bending residues and can be used
to identify hinge bending residues.
Probably only informative for interdomain rotations greater than 20 degrees
Residue
iResidue
i+1Distance of hinge axis to residue i in
(A) Distance of hinge axis to residue i in
(A) Change in
(deg) Change in
(deg) Angle of psi(i) axis to hinge axis
(deg) Angle of psi(i) axis to hinge axis
(deg) Percentage Progress
ASP-211
ASP-212
8.2
9.0
55.2
-28.9
27.9
33.1
116.7
ASP-212
TYR-213
7.8
8.1
49.2
-32.8
73.8
72.2
56.6
TYR-213
ASN-214
4.0
4.5
-7.1
5.5
66.8
64.3
20.6
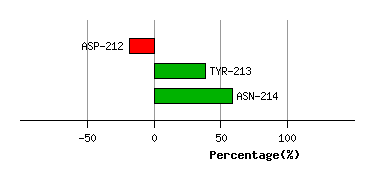
Graph shows rotational transition at bending residues and can be used
to identify hinge bending residues.
Probably only informative for interdomain rotations greater than 20 degrees
Residue
iResidue
i+1Distance of hinge axis to residue i in
(A) Distance of hinge axis to residue i in
(A) Change in
(deg) Change in
(deg) Angle of psi(i) axis to hinge axis
(deg) Angle of psi(i) axis to hinge axis
(deg) Percentage Progress
ALA-441
SER-442
13.5
13.4
-170.6
179.4
79.1
61.8
-34.2
SER-442
PRO-443
12.7
11.9
0.0
10.6
105.5
134.1
-18.8
PRO-443
LYS-444
9.6
10.1
-10.9
3.3
67.3
65.3
27.1
LYS-444
SER-445
7.3
8.8
39.3
-95.7
173.8
153.5
272.3
SER-445
THR-446
6.5
9.6
-107.2
170.8
65.4
74.6
-156.0
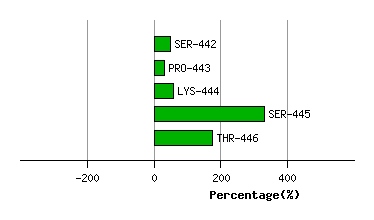
Graph shows rotational transition at bending residues and can be used
to identify hinge bending residues.
Probably only informative for interdomain rotations greater than 20 degrees
Residue
iResidue
i+1Distance of hinge axis to residue i in
(A) Distance of hinge axis to residue i in
(A) Change in
(deg) Change in
(deg) Angle of psi(i) axis to hinge axis
(deg) Angle of psi(i) axis to hinge axis
(deg) Percentage Progress
GLY-448
ILE-449
6.6
7.4
-56.1
6.7
55.3
49.0
131.5
ILE-449
GLY-450
9.1
9.5
8.6
-1.7
59.7
61.7
10.2
GLY-450
ASP-451
11.8
12.2
-4.0
4.4
118.2
116.9
-0.5
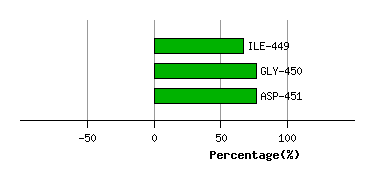
Graph shows rotational transition at bending residues and can be used
to identify hinge bending residues.
Probably only informative for interdomain rotations greater than 20 degrees