Proto-Oncogene Cbl
(All numbering and residues are taken from first PDB file)
![]()
![]()
Bending Residue Dihedral Analysis
Residue
iResidue
i+1Distance of hinge axis to residue i in
(A) Distance of hinge axis to residue i in
(A) Change in
(deg) Change in
(deg) Angle of psi(i) axis to hinge axis
(deg) Angle of psi(i) axis to hinge axis
(deg) Percentage Progress
ASN-257
TRP-258
4.7
4.8
-3.5
15.9
87.9
90.6
-31.9
TRP-258
ASN-259
3.8
3.8
-24.2
15.1
19.6
23.9
101.2
ASN-259
SER-260
4.2
4.1
-5.9
-5.9
70.8
70.9
-3.3
SER-260
LEU-261
1.4
1.6
27.0
-12.3
65.7
55.7
-15.4
LEU-261
ALA-262
1.4
1.3
-12.5
-2.6
92.4
89.9
-20.2
ALA-262
VAL-263
4.0
3.8
31.7
-21.1
145.2
136.2
-31.5
VAL-263
THR-264
5.5
5.2
-16.5
9.5
29.8
39.0
40.1
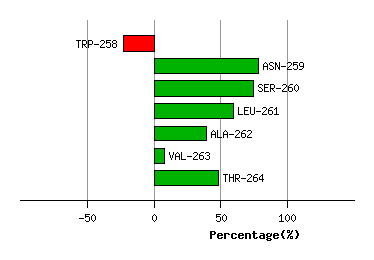
Graph shows rotational transition at bending residues and can be used
to identify hinge bending residues.
Probably only informative for interdomain rotations greater than 20 degrees
Residue
iResidue
i+1Distance of hinge axis to residue i in
(A) Distance of hinge axis to residue i in
(A) Change in
(deg) Change in
(deg) Angle of psi(i) axis to hinge axis
(deg) Angle of psi(i) axis to hinge axis
(deg) Percentage Progress
TYR-268
MET-269
7.8
7.8
-6.3
18.9
84.5
85.2
-34.1
MET-269
ALA-270
10.9
10.9
-109.7
104.7
39.5
53.8
-55.7
ALA-270
PHE-271
11.3
10.1
-63.4
34.9
38.7
38.6
216.0
PHE-271
LEU-272
14.0
12.2
52.4
-28.7
92.2
76.0
-23.7
LEU-272
THR-273
15.0
14.8
22.5
8.9
149.2
152.2
-109.4
THR-273
TYR-274
16.4
16.7
-2.1
-8.9
103.5
104.6
-6.0
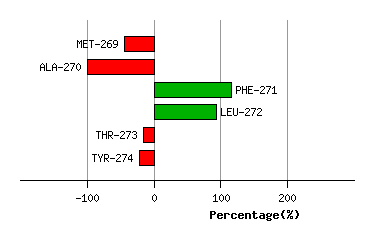
Graph shows rotational transition at bending residues and can be used
to identify hinge bending residues.
Probably only informative for interdomain rotations greater than 20 degrees
Residue
iResidue
i+1Distance of hinge axis to residue i in
(A) Distance of hinge axis to residue i in
(A) Change in
(deg) Change in
(deg) Angle of psi(i) axis to hinge axis
(deg) Angle of psi(i) axis to hinge axis
(deg) Percentage Progress
PHE-293
ARG-294
10.0
9.8
-27.8
27.7
74.3
72.8
-60.8
ARG-294
LEU-295
9.2
9.7
-23.2
-15.6
27.2
35.1
147.4
LEU-295
SER-296
8.0
8.5
26.7
-64.6
125.5
127.5
120.3
SER-296
CYS-297
9.7
10.5
-17.7
23.2
54.7
49.5
-9.8
CYS-297
THR-298
11.6
11.9
9.6
-1.1
166.0
165.0
-101.5
THR-298
ARG-299
11.4
11.7
0.9
-5.5
104.1
103.3
56.1
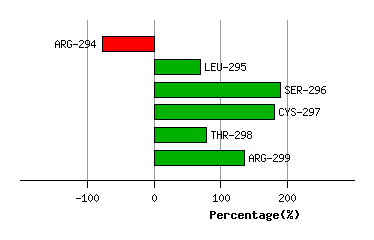
Graph shows rotational transition at bending residues and can be used
to identify hinge bending residues.
Probably only informative for interdomain rotations greater than 20 degrees
Residue
iResidue
i+1Distance of hinge axis to residue i in
(A) Distance of hinge axis to residue i in
(A) Change in
(deg) Change in
(deg) Angle of psi(i) axis to hinge axis
(deg) Angle of psi(i) axis to hinge axis
(deg) Percentage Progress
LEU-300
GLY-301
6.3
6.2
13.5
-25.4
93.4
94.6
82.1
GLY-301
GLN-302
2.8
2.8
38.0
-32.1
117.7
98.0
-26.3
GLN-302
TRP-303
4.9
4.6
-14.5
-5.1
38.4
36.3
111.6
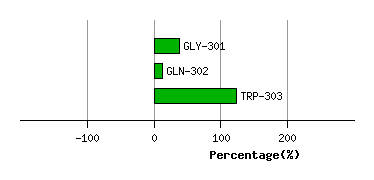
Graph shows rotational transition at bending residues and can be used
to identify hinge bending residues.
Probably only informative for interdomain rotations greater than 20 degrees