Dna-Directed RNA Polymerase II Largest Subunit
(All numbering and residues are taken from first PDB file)
![]()
![]()
Bending Residue Dihedral Analysis
Residue
iResidue
i+1Distance of hinge axis to residue i in
(A) Distance of hinge axis to residue i in
(A) Change in
(deg) Change in
(deg) Angle of psi(i) axis to hinge axis
(deg) Angle of psi(i) axis to hinge axis
(deg) Percentage Progress
ARG-344
VAL-345
18.2
18.2
66.4
-55.0
45.6
60.9
9.1
VAL-345
ASP-346
16.8
16.0
57.2
7.9
34.0
23.9
157.1
ASP-346
PHE-347
15.6
16.2
40.1
-17.5
45.4
47.9
60.2
PHE-347
SER-348
14.3
14.5
18.6
-19.4
87.4
96.3
11.7
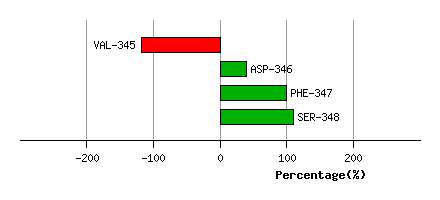
Graph shows rotational transition at bending residues and can be used
to identify hinge bending residues.
Probably only informative for interdomain rotations greater than 20 degrees
Residue
iResidue
i+1Distance of hinge axis to residue i in
(A) Distance of hinge axis to residue i in
(A) Change in
(deg) Change in
(deg) Angle of psi(i) axis to hinge axis
(deg) Angle of psi(i) axis to hinge axis
(deg) Percentage Progress
LEU-1381
THR-1382
26.3
25.4
-12.2
10.9
91.4
87.6
2.0
THR-1382
SER-1383
23.4
22.2
-20.8
15.6
39.3
44.6
20.3
SER-1383
VAL-1384
24.4
23.5
-18.2
40.2
56.6
48.4
-30.4
VAL-1384
THR-1385
22.4
22.1
76.3
-79.0
104.9
80.8
12.6
THR-1385
ARG-1386
24.3
22.0
80.6
-69.5
44.4
53.0
64.4
ARG-1386
HIS-1387
21.6
20.1
-136.1
13.5
166.3
157.4
-353.5
HIS-1387
GLY-1388
21.2
20.8
58.0
-49.9
63.3
87.4
10.6
GLY-1388
PHE-1389
18.3
19.3
105.4
43.6
120.3
119.2
426.5
PHE-1389
ASN-1390
18.7
17.1
3.6
36.4
108.1
92.6
25.0
ASN-1390
ARG-1391
14.9
15.2
-69.9
119.7
82.5
155.8
37.3
ARG-1391
SER-1392
13.2
13.9
149.9
155.5
111.2
86.2
-11.6
SER-1392
ASN-1393
14.5
12.7
-156.7
138.8
71.6
91.2
-69.1
ASN-1393
THR-1394
11.3
9.4
-67.9
76.4
52.9
35.7
-25.3
THR-1394
GLY-1395
8.9
8.4
-53.2
86.6
120.8
102.9
28.2
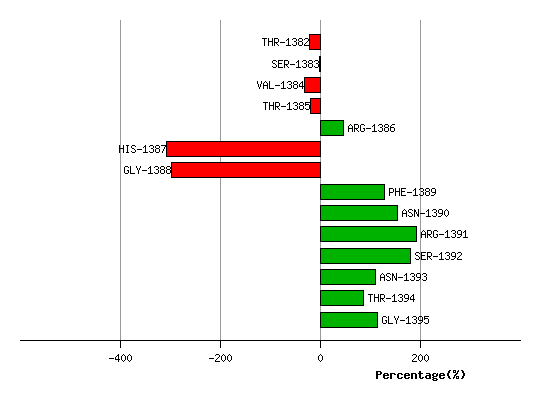
Graph shows rotational transition at bending residues and can be used
to identify hinge bending residues.
Probably only informative for interdomain rotations greater than 20 degrees
Residue
iResidue
i+1Distance of hinge axis to residue i in
(A) Distance of hinge axis to residue i in
(A) Change in
(deg) Change in
(deg) Angle of psi(i) axis to hinge axis
(deg) Angle of psi(i) axis to hinge axis
(deg) Percentage Progress
GLN-1432
MET-1433
4.2
4.1
-4.1
13.2
105.9
118.0
26.4
MET-1433
ALA-1434
1.0
1.0
-18.6
-8.1
33.1
45.4
62.8
ALA-1434
PRO-1435
2.1
2.1
-13.0
9.0
103.1
101.0
9.6
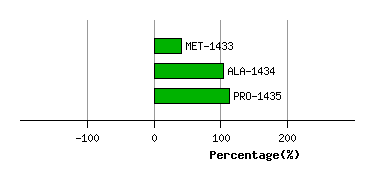
Graph shows rotational transition at bending residues and can be used
to identify hinge bending residues.
Probably only informative for interdomain rotations greater than 20 degrees