Orotidine 5'-Phosphate Decarboxylase
(All numbering and residues are taken from first PDB file)
![]()
![]()
Bending Residue Dihedral Analysis
Residue
iResidue
i+1Distance of hinge axis to residue i in
(A) Distance of hinge axis to residue i in
(A) Change in
(deg) Change in
(deg) Angle of psi(i) axis to hinge axis
(deg) Angle of psi(i) axis to hinge axis
(deg) Percentage Progress
LEU-11
ASP-12
3.9
4.2
11.1
-12.6
102.5
101.0
0.3
ASP-12
PHE-13
7.6
7.9
0.2
-3.6
150.1
153.0
19.6
PHE-13
PRO-14
8.0
8.2
12.6
5.4
114.4
113.7
-86.4
PRO-14
SER-15
10.9
10.7
-21.1
-7.0
42.9
61.6
183.5
SER-15
LYS-16
9.0
8.8
24.9
1.8
89.7
92.9
-10.8
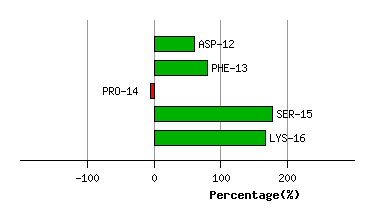
Graph shows rotational transition at bending residues and can be used
to identify hinge bending residues.
Probably only informative for interdomain rotations greater than 20 degrees
Residue
iResidue
i+1Distance of hinge axis to residue i in
(A) Distance of hinge axis to residue i in
(A) Change in
(deg) Change in
(deg) Angle of psi(i) axis to hinge axis
(deg) Angle of psi(i) axis to hinge axis
(deg) Percentage Progress
PHE-26
ALA-27
8.4
8.5
3.2
11.7
66.2
70.2
89.9
ALA-27
GLY-28
9.3
9.8
-23.1
14.4
68.8
57.0
51.4
GLY-28
THR-29
12.7
13.0
54.3
-41.7
176.9
168.1
-128.8
THR-29
PRO-30
11.4
11.3
3.8
-1.8
109.7
105.9
30.7
PRO-30
LEU-31
10.1
10.2
-3.3
3.2
42.9
52.1
35.9
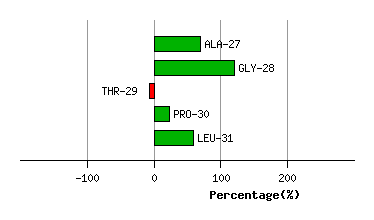
Graph shows rotational transition at bending residues and can be used
to identify hinge bending residues.
Probably only informative for interdomain rotations greater than 20 degrees
Residue
iResidue
i+1Distance of hinge axis to residue i in
(A) Distance of hinge axis to residue i in
(A) Change in
(deg) Change in
(deg) Angle of psi(i) axis to hinge axis
(deg) Angle of psi(i) axis to hinge axis
(deg) Percentage Progress
ASP-210
TYR-211
4.6
4.4
-1.7
-1.0
15.6
13.1
41.5
TYR-211
ILE-212
2.9
2.9
0.7
0.4
96.4
93.5
-30.8
ILE-212
VAL-213
1.7
1.6
-1.2
-5.9
17.1
19.8
77.3
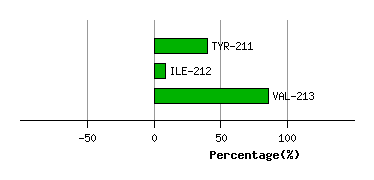
Graph shows rotational transition at bending residues and can be used
to identify hinge bending residues.
Probably only informative for interdomain rotations greater than 20 degrees