Lactoferrin
(All numbering and residues are taken from first PDB file)
![]()
![]()
Bending Residue Dihedral Analysis
Residue
iResidue
i+1Distance of hinge axis to residue i in
(A) Distance of hinge axis to residue i in
(A) Change in
(deg) Change in
(deg) Angle of psi(i) axis to hinge axis
(deg) Angle of psi(i) axis to hinge axis
(deg) Percentage Progress
ALA-56
VAL-57
17.5
17.3
-8.9
4.4
48.2
46.2
88.9
VAL-57
THR-58
15.2
15.2
-12.5
6.0
71.5
70.7
-20.2
THR-58
LEU-59
11.9
11.7
-5.4
-8.1
8.0
2.3
196.7
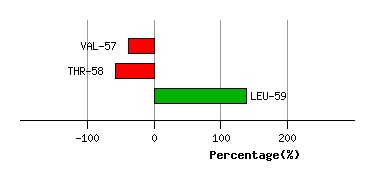
Graph shows rotational transition at bending residues and can be used
to identify hinge bending residues.
Probably only informative for interdomain rotations greater than 20 degrees
Residue
iResidue
i+1Distance of hinge axis to residue i in
(A) Distance of hinge axis to residue i in
(A) Change in
(deg) Change in
(deg) Angle of psi(i) axis to hinge axis
(deg) Angle of psi(i) axis to hinge axis
(deg) Percentage Progress
PHE-63
ILE-64
15.4
14.7
-8.5
-12.7
46.2
44.6
254.9
ILE-64
TYR-65
16.3
15.7
1.5
10.9
72.0
60.0
8.2
TYR-65
GLU-66
19.0
17.8
-8.8
-3.3
100.5
96.9
-20.8
GLU-66
ALA-67
20.4
19.4
18.3
-14.7
148.2
145.7
-37.0
ALA-67
GLY-68
20.7
20.1
-9.5
9.7
61.2
72.4
39.0
GLY-68
LEU-69
22.6
21.9
-3.4
10.2
113.8
122.3
53.6
LEU-69
ALA-70
25.5
24.4
-3.9
-4.9
74.3
68.1
62.4
ALA-70
PRO-71
28.6
27.7
2.5
5.9
48.3
58.2
-87.6
PRO-71
TYR-72
29.2
28.9
10.5
-22.1
136.5
143.5
18.8
TYR-72
LYS-73
25.9
25.8
1.0
-5.2
141.3
129.8
154.5
LYS-73
LEU-74
25.5
25.0
18.2
-2.9
132.7
140.4
-179.6
LEU-74
ARG-75
22.1
21.9
4.9
4.6
91.6
92.3
7.3
ARG-75
PRO-76
20.4
20.1
10.4
-9.5
117.1
114.3
27.2
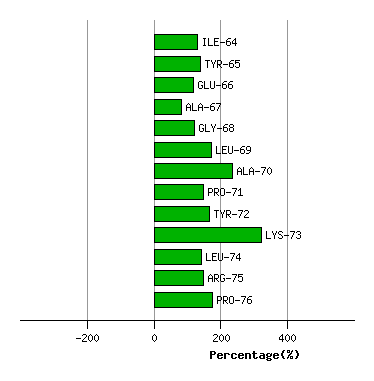
Graph shows rotational transition at bending residues and can be used
to identify hinge bending residues.
Probably only informative for interdomain rotations greater than 20 degrees
Residue
iResidue
i+1Distance of hinge axis to residue i in
(A) Distance of hinge axis to residue i in
(A) Change in
(deg) Change in
(deg) Angle of psi(i) axis to hinge axis
(deg) Angle of psi(i) axis to hinge axis
(deg) Percentage Progress
THR-90
HIS-91
9.5
9.3
1.6
-0.4
169.7
164.2
-51.5
HIS-91
TYR-92
9.5
9.5
-0.6
-0.5
69.4
62.8
77.8
TYR-92
TYR-93
7.4
7.6
-0.3
-3.5
20.5
20.1
-59.9
TYR-93
ALA-94
8.0
8.1
-5.9
9.9
45.3
48.3
46.6
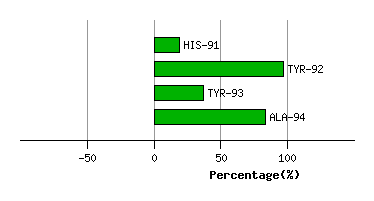
Graph shows rotational transition at bending residues and can be used
to identify hinge bending residues.
Probably only informative for interdomain rotations greater than 20 degrees
Residue
iResidue
i+1Distance of hinge axis to residue i in
(A) Distance of hinge axis to residue i in
(A) Change in
(deg) Change in
(deg) Angle of psi(i) axis to hinge axis
(deg) Angle of psi(i) axis to hinge axis
(deg) Percentage Progress
THR-213
VAL-214
6.1
5.9
-1.5
1.7
100.2
102.4
29.4
VAL-214
PHE-215
9.5
9.3
0.4
-4.1
147.3
139.9
47.4
PHE-215
GLU-216
10.7
10.9
10.1
-15.4
125.3
127.1
68.9
GLU-216
ASP-217
9.1
9.6
7.0
-5.1
68.0
67.3
-53.3
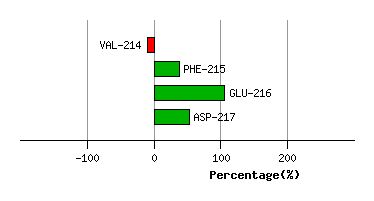
Graph shows rotational transition at bending residues and can be used
to identify hinge bending residues.
Probably only informative for interdomain rotations greater than 20 degrees
Residue
iResidue
i+1Distance of hinge axis to residue i in
(A) Distance of hinge axis to residue i in
(A) Change in
(deg) Change in
(deg) Angle of psi(i) axis to hinge axis
(deg) Angle of psi(i) axis to hinge axis
(deg) Percentage Progress
ARG-224
ASP-225
15.7
15.8
-1.9
6.8
35.9
36.4
-105.6
ASP-225
GLU-226
18.0
18.3
1.2
-2.5
155.1
150.4
74.4
GLU-226
TYR-227
16.7
16.5
-5.8
0.4
76.2
79.0
75.9
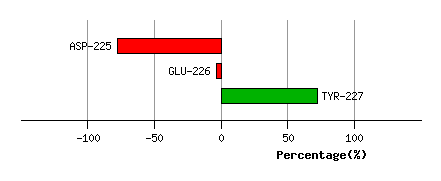
Graph shows rotational transition at bending residues and can be used
to identify hinge bending residues.
Probably only informative for interdomain rotations greater than 20 degrees
Residue
iResidue
i+1Distance of hinge axis to residue i in
(A) Distance of hinge axis to residue i in
(A) Change in
(deg) Change in
(deg) Angle of psi(i) axis to hinge axis
(deg) Angle of psi(i) axis to hinge axis
(deg) Percentage Progress
ARG-249
VAL-250
11.8
11.7
1.2
-9.0
104.9
109.9
-74.8
VAL-250
PRO-251
10.6
11.0
0.3
2.1
163.8
164.6
13.3
PRO-251
SER-252
11.1
11.3
-2.8
6.5
80.9
84.8
-23.8
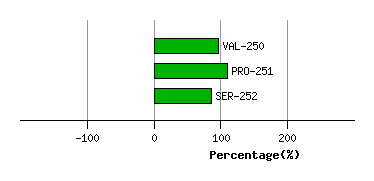
Graph shows rotational transition at bending residues and can be used
to identify hinge bending residues.
Probably only informative for interdomain rotations greater than 20 degrees