Serum Albumin
(All numbering and residues are taken from first PDB file)
![]()
![]()
Bending Residue Dihedral Analysis
Residue
iResidue
i+1Distance of hinge axis to residue i in
(A) Distance of hinge axis to residue i in
(A) Change in
(deg) Change in
(deg) Angle of psi(i) axis to hinge axis
(deg) Angle of psi(i) axis to hinge axis
(deg) Percentage Progress
TYR-497
VAL-498
8.8
8.8
3.0
-1.8
86.5
90.3
-55.1
VAL-498
PRO-499
10.2
9.8
-0.3
33.5
152.7
152.8
187.1
PRO-499
LYS-500
8.6
8.4
-12.1
31.7
128.1
137.6
225.4
LYS-500
GLU-501
10.5
9.7
63.4
-109.6
74.5
79.4
-85.7
GLU-501
PHE-502
11.6
12.0
-139.2
113.0
136.1
163.2
-276.5
PHE-502
ASN-503
11.0
11.9
24.9
-65.0
31.5
58.2
-294.2
ASN-503
ALA-504
11.5
13.8
29.2
17.8
53.1
31.1
397.0
ALA-504
GLU-505
12.4
13.4
-15.6
-8.9
144.2
112.3
-71.5
GLU-505
THR-506
11.4
12.1
13.5
53.3
85.5
122.5
-70.4
THR-506
PHE-507
7.7
9.5
-69.9
-11.3
80.9
122.8
-102.0
PHE-507
THR-508
7.4
7.1
109.8
1.9
39.6
36.5
815.9
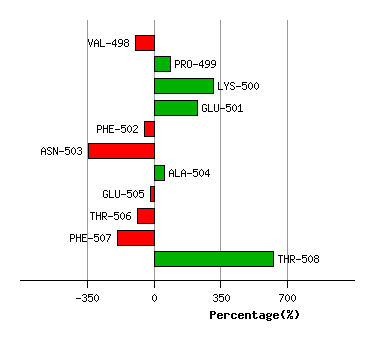
Graph shows rotational transition at bending residues and can be used
to identify hinge bending residues.
Probably only informative for interdomain rotations greater than 20 degrees
Residue
iResidue
i+1Distance of hinge axis to residue i in
(A) Distance of hinge axis to residue i in
(A) Change in
(deg) Change in
(deg) Angle of psi(i) axis to hinge axis
(deg) Angle of psi(i) axis to hinge axis
(deg) Percentage Progress
HIS-510
ALA-511
7.1
7.9
-45.7
30.7
56.8
73.1
-1.3
ALA-511
ASP-512
8.0
7.9
-13.6
43.0
61.2
73.5
-75.5
ASP-512
ILE-513
4.5
4.3
-9.3
-1.0
124.4
117.4
3.8
ILE-513
CYS-514
5.0
4.5
-1.9
2.9
68.9
66.5
-1.8
CYS-514
THR-515
8.2
7.6
5.5
-2.0
136.0
137.8
-42.7
THR-515
LEU-516
6.4
5.9
-7.1
16.0
110.3
110.3
50.2
LEU-516
SER-517
6.3
5.8
-8.5
8.8
106.4
102.1
38.0
SER-517
GLU-518
9.8
9.3
0.1
9.9
23.3
25.1
111.5
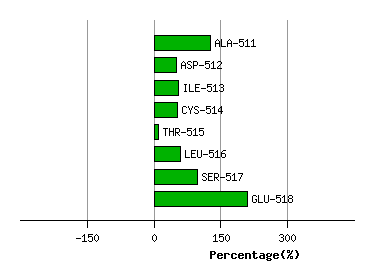
Graph shows rotational transition at bending residues and can be used
to identify hinge bending residues.
Probably only informative for interdomain rotations greater than 20 degrees
Residue
iResidue
i+1Distance of hinge axis to residue i in
(A) Distance of hinge axis to residue i in
(A) Change in
(deg) Change in
(deg) Angle of psi(i) axis to hinge axis
(deg) Angle of psi(i) axis to hinge axis
(deg) Percentage Progress
HIS-535
LYS-536
5.7
6.0
7.6
-2.1
147.4
143.6
-25.1
LYS-536
PRO-537
4.9
5.1
-10.4
34.1
67.2
63.5
-104.0
PRO-537
LYS-538
1.6
1.8
-39.4
-2.6
27.4
47.8
321.4
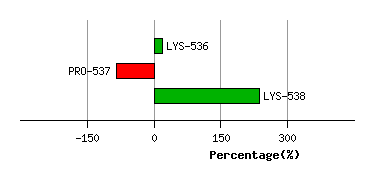
Graph shows rotational transition at bending residues and can be used
to identify hinge bending residues.
Probably only informative for interdomain rotations greater than 20 degrees
Residue
iResidue
i+1Distance of hinge axis to residue i in
(A) Distance of hinge axis to residue i in
(A) Change in
(deg) Change in
(deg) Angle of psi(i) axis to hinge axis
(deg) Angle of psi(i) axis to hinge axis
(deg) Percentage Progress
LYS-557
CYS-558
16.4
16.5
13.0
-8.3
136.2
134.3
-55.6
CYS-558
CYS-559
14.6
14.4
-6.8
-10.0
35.4
36.3
147.5
CYS-559
LYS-560
12.9
12.6
-15.2
26.7
45.5
50.9
-41.9
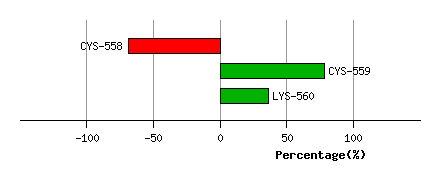
Graph shows rotational transition at bending residues and can be used
to identify hinge bending residues.
Probably only informative for interdomain rotations greater than 20 degrees
Residue
iResidue
i+1Distance of hinge axis to residue i in
(A) Distance of hinge axis to residue i in
(A) Change in
(deg) Change in
(deg) Angle of psi(i) axis to hinge axis
(deg) Angle of psi(i) axis to hinge axis
(deg) Percentage Progress
ALA-561
ASP-562
18.0
17.8
157.6
-161.3
28.5
29.5
-39.4
ASP-562
ASP-563
17.5
17.8
-18.7
2.6
86.6
95.6
25.7
ASP-563
LYS-564
17.0
18.3
-12.0
63.9
131.3
107.2
297.5
LYS-564
GLU-565
15.8
15.8
126.2
-145.1
51.3
30.0
-107.0
LYS-564
GLU-565
15.8
15.8
126.2
-145.1
51.3
30.0
-107.0
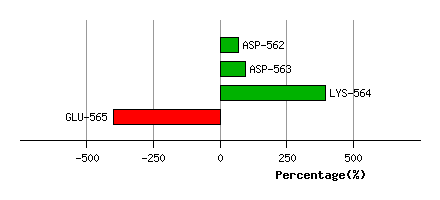
Graph shows rotational transition at bending residues and can be used
to identify hinge bending residues.
Probably only informative for interdomain rotations greater than 20 degrees
Residue
iResidue
i+1Distance of hinge axis to residue i in
(A) Distance of hinge axis to residue i in
(A) Change in
(deg) Change in
(deg) Angle of psi(i) axis to hinge axis
(deg) Angle of psi(i) axis to hinge axis
(deg) Percentage Progress
LYS-564
GLU-565
15.8
15.8
126.2
-145.1
51.3
30.0
-107.0
LYS-564
GLU-565
15.8
15.8
126.2
-145.1
51.3
30.0
-107.0
GLU-565
THR-566
13.3
13.2
49.2
-19.4
40.6
51.3
209.7
THR-566
CYS-567
16.5
16.0
35.9
-5.1
28.7
20.8
261.8
CYS-567
PHE-568
16.8
16.7
11.7
1.3
61.7
55.6
58.8
PHE-568
ALA-569
13.1
13.2
19.7
-15.2
58.4
58.0
20.5
ALA-569
GLU-570
13.4
14.9
1.8
3.0
48.9
47.0
80.3
GLU-570
GLU-571
16.9
18.0
-29.8
10.4
139.5
138.8
-158.1
GLU-571
GLY-572
16.3
16.6
8.5
-1.0
47.9
59.4
27.7
GLY-572
LYS-573
13.2
13.5
0.7
-20.5
55.6
35.2
-102.2
LYS-573
LYS-574
15.8
15.9
22.3
7.5
38.9
51.8
182.4
LYS-574
LEU-575
17.7
17.5
-20.5
21.0
129.6
134.0
32.6
LEU-575
VAL-576
14.8
14.5
-16.4
21.1
125.0
136.9
2.1
VAL-576
ALA-577
12.9
13.6
-15.1
13.5
142.2
138.9
-34.2
ALA-577
ALA-578
16.0
16.9
-10.0
5.6
131.9
128.9
-9.3
ALA-578
SER-579
15.7
16.2
-15.2
31.6
123.3
124.0
68.1
SER-579
GLN-580
12.1
12.5
-27.9
10.8
132.7
147.0
-157.2
GLN-580
ALA-581
12.5
13.5
3.0
8.5
28.5
43.3
96.6
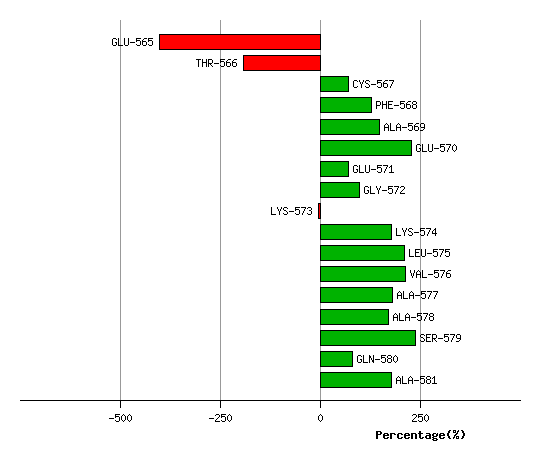
Graph shows rotational transition at bending residues and can be used
to identify hinge bending residues.
Probably only informative for interdomain rotations greater than 20 degrees