Leu/ile/val-Binding Protein
(All numbering and residues are taken from first PDB file)
![]()
![]()
Bending Residue Dihedral Analysis
Residue
iResidue
i+1Distance of hinge axis to residue i in
(A) Distance of hinge axis to residue i in
(A) Change in
(deg) Change in
(deg) Angle of psi(i) axis to hinge axis
(deg) Angle of psi(i) axis to hinge axis
(deg) Percentage Progress
ARG-116
THR-117
9.7
10.0
0.7
7.4
146.3
146.7
-8.6
THR-117
THR-118
9.8
9.9
2.9
-14.6
122.5
117.0
8.8
THR-118
GLY-119
6.8
6.6
30.4
-5.8
63.9
50.8
15.8
GLY-119
LEU-120
3.2
3.1
29.4
-8.1
64.4
41.4
12.6
LEU-120
ASP-121
1.8
2.1
-13.5
-19.8
68.1
76.8
21.1
ASP-121
SER-122
4.1
4.8
31.7
-22.5
74.4
65.2
-3.4
SER-122
ASP-123
4.3
4.4
19.3
-43.6
122.2
134.3
28.5
ASP-123
GLN-124
3.8
4.1
-31.0
10.2
40.8
42.8
35.4
GLN-124
GLY-125
5.8
5.1
-15.1
-1.0
104.5
97.1
-3.5
GLY-125
PRO-126
8.8
8.5
9.6
-2.0
104.2
102.4
4.3
PRO-126
THR-127
9.6
9.6
1.6
0.1
169.4
166.5
-3.0
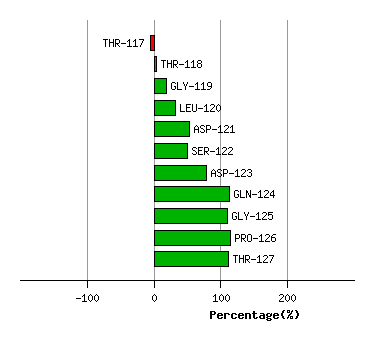
Graph shows rotational transition at bending residues and can be used
to identify hinge bending residues.
Probably only informative for interdomain rotations greater than 20 degrees
Residue
iResidue
i+1Distance of hinge axis to residue i in
(A) Distance of hinge axis to residue i in
(A) Change in
(deg) Change in
(deg) Angle of psi(i) axis to hinge axis
(deg) Angle of psi(i) axis to hinge axis
(deg) Percentage Progress
VAL-246
THR-247
9.6
9.9
11.0
-3.9
105.9
107.5
10.3
THR-247
LYS-248
6.6
6.9
3.5
-4.1
92.9
88.8
14.0
LYS-248
PRO-249
3.9
4.7
0.4
-15.9
80.9
81.6
-6.9
PRO-249
LYS-250
1.5
2.8
17.9
16.4
28.0
14.9
51.9
LYS-250
ASN-251
2.0
2.1
1.3
15.9
60.5
55.6
17.1
ASN-251
TYR-252
3.7
4.0
-4.9
2.5
97.9
98.1
2.8
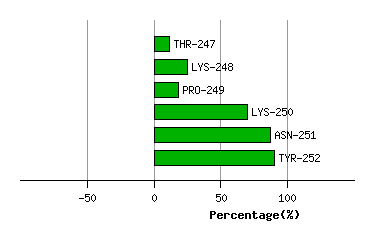
Graph shows rotational transition at bending residues and can be used
to identify hinge bending residues.
Probably only informative for interdomain rotations greater than 20 degrees
Residue
iResidue
i+1Distance of hinge axis to residue i in
(A) Distance of hinge axis to residue i in
(A) Change in
(deg) Change in
(deg) Angle of psi(i) axis to hinge axis
(deg) Angle of psi(i) axis to hinge axis
(deg) Percentage Progress
ASP-323
LEU-324
6.7
7.1
0.1
-9.1
129.9
132.7
3.0
LEU-324
LYS-325
7.6
7.8
-10.1
34.0
102.0
94.6
-2.4
LYS-325
GLY-326
8.6
8.6
0.5
-5.6
144.7
155.9
5.8
GLY-326
PHE-327
9.4
7.9
-3.9
0.5
34.4
49.4
0.2
PHE-327
GLU-328
6.6
4.8
9.8
-19.9
121.5
103.8
11.2
GLU-328
PHE-329
6.0
3.2
3.3
-12.4
129.0
123.3
16.2
PHE-329
GLY-330
3.2
1.8
-33.4
-7.1
31.1
46.5
51.7
GLY-330
VAL-331
4.1
3.6
6.3
12.6
93.7
98.3
-3.6
VAL-331
PHE-332
7.0
6.9
-2.7
-2.4
14.4
13.1
8.8
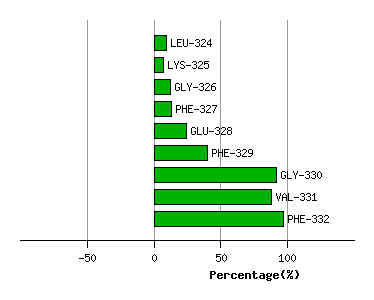
Graph shows rotational transition at bending residues and can be used
to identify hinge bending residues.
Probably only informative for interdomain rotations greater than 20 degrees