Aspartate Aminotransferase
(All numbering and residues are taken from first PDB file)
![]()
![]()
Bending Residue Dihedral Analysis
Residue
iResidue
i+1Distance of hinge axis to residue i in
(A) Distance of hinge axis to residue i in
(A) Change in
(deg) Change in
(deg) Angle of psi(i) axis to hinge axis
(deg) Angle of psi(i) axis to hinge axis
(deg) Percentage Progress
ILE-33
ASN-34
12.8
12.4
7.2
-6.0
66.5
63.7
22.4
ASN-34
LEU-35
10.8
10.9
-10.1
27.7
106.0
101.3
47.4
LEU-35
GLY-36
7.8
7.6
-10.6
-5.7
116.6
111.6
-49.0
GLY-36
ILE-37
9.2
9.0
96.8
-7.7
112.9
131.4
-798.0
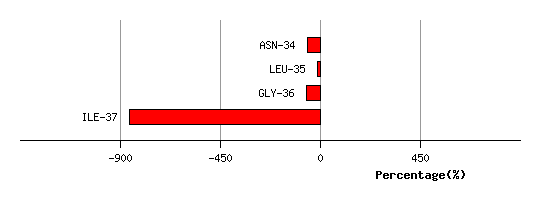
Graph shows rotational transition at bending residues and can be used
to identify hinge bending residues.
Probably only informative for interdomain rotations greater than 20 degrees
Residue
iResidue
i+1Distance of hinge axis to residue i in
(A) Distance of hinge axis to residue i in
(A) Change in
(deg) Change in
(deg) Angle of psi(i) axis to hinge axis
(deg) Angle of psi(i) axis to hinge axis
(deg) Percentage Progress
GLY-38
VAL-39
7.2
7.9
-101.5
14.7
15.8
28.0
1171.0
VAL-39
TYR-40
6.6
7.2
12.6
-2.7
103.3
101.6
26.7
TYR-40
LYS-41
3.4
3.7
2.8
5.8
127.2
128.3
-58.2
LYS-41
ASP-42
2.6
2.9
2.8
-1.7
105.9
106.2
-0.9
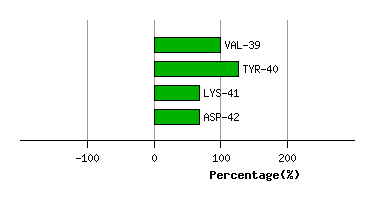
Graph shows rotational transition at bending residues and can be used
to identify hinge bending residues.
Probably only informative for interdomain rotations greater than 20 degrees
Residue
iResidue
i+1Distance of hinge axis to residue i in
(A) Distance of hinge axis to residue i in
(A) Change in
(deg) Change in
(deg) Angle of psi(i) axis to hinge axis
(deg) Angle of psi(i) axis to hinge axis
(deg) Percentage Progress
MET-333
ARG-334
7.5
7.4
0.1
-6.8
175.6
174.2
111.4
ARG-334
GLN-335
7.4
7.2
2.6
-0.6
108.6
103.8
-33.8
GLN-335
LEU-336
11.2
11.1
5.5
-6.6
84.4
85.4
-3.1
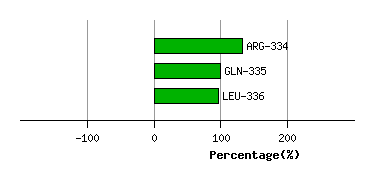
Graph shows rotational transition at bending residues and can be used
to identify hinge bending residues.
Probably only informative for interdomain rotations greater than 20 degrees
Residue
iResidue
i+1Distance of hinge axis to residue i in
(A) Distance of hinge axis to residue i in
(A) Change in
(deg) Change in
(deg) Angle of psi(i) axis to hinge axis
(deg) Angle of psi(i) axis to hinge axis
(deg) Percentage Progress
ASP-349
PHE-350
11.6
11.1
-41.1
25.2
61.3
61.0
41.0
PHE-350
SER-351
9.1
9.1
-16.6
-10.9
63.0
60.4
156.5
SER-351
PHE-352
10.8
10.8
11.0
3.4
98.9
89.3
-81.8
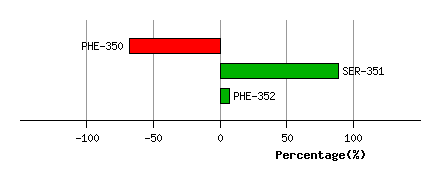
Graph shows rotational transition at bending residues and can be used
to identify hinge bending residues.
Probably only informative for interdomain rotations greater than 20 degrees
Residue
iResidue
i+1Distance of hinge axis to residue i in
(A) Distance of hinge axis to residue i in
(A) Change in
(deg) Change in
(deg) Angle of psi(i) axis to hinge axis
(deg) Angle of psi(i) axis to hinge axis
(deg) Percentage Progress
GLN-356
ASN-357
7.3
7.7
8.8
-8.9
19.9
11.4
44.8
ASN-357
GLY-358
8.2
8.4
0.9
-1.0
62.0
64.1
-54.4
GLY-358
MET-359
6.6
6.6
4.3
-14.9
81.4
89.4
144.9
MET-359
PHE-360
3.5
3.3
24.1
-22.3
142.1
147.5
-92.2
PHE-360
SER-361
2.9
3.0
8.5
-38.1
137.2
145.4
575.3
SER-361
PHE-362
0.8
1.8
19.8
16.6
139.5
123.7
-341.3
PHE-362
SER-363
1.0
1.5
24.3
-8.7
110.6
96.0
18.2
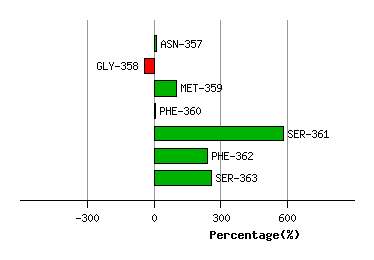
Graph shows rotational transition at bending residues and can be used
to identify hinge bending residues.
Probably only informative for interdomain rotations greater than 20 degrees
Residue
iResidue
i+1Distance of hinge axis to residue i in
(A) Distance of hinge axis to residue i in
(A) Change in
(deg) Change in
(deg) Angle of psi(i) axis to hinge axis
(deg) Angle of psi(i) axis to hinge axis
(deg) Percentage Progress
GLY-385
ARG-386
6.6
6.4
-0.9
9.0
42.9
42.8
-22.9
ARG-386
VAL-387
5.0
4.9
-1.5
4.2
39.0
36.2
-81.1
VAL-387
ASN-388
4.5
4.1
4.2
-15.3
140.6
137.7
244.7
ASN-388
VAL-389
3.4
3.0
0.5
12.7
113.4
114.2
-114.3
VAL-389
ALA-390
1.9
2.0
-6.2
-2.1
3.3
8.3
156.1
ALA-390
GLY-391
0.7
1.5
12.9
0.9
114.8
103.1
-133.9
GLY-391
MET-392
4.4
5.1
-1.7
-2.0
92.0
93.6
-136.1
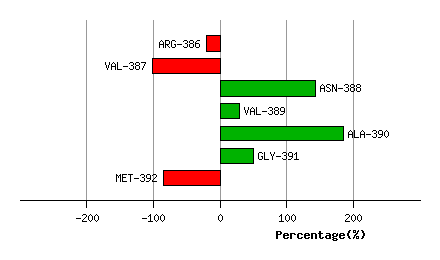
Graph shows rotational transition at bending residues and can be used
to identify hinge bending residues.
Probably only informative for interdomain rotations greater than 20 degrees