Protein Translocase Subunit Seca
(All numbering and residues are taken from first PDB file)
![]()
![]()
Bending Residue Dihedral Analysis
Residue
iResidue
i+1Distance of hinge axis to residue i in
(A) Distance of hinge axis to residue i in
(A) Change in
(deg) Change in
(deg) Angle of psi(i) axis to hinge axis
(deg) Angle of psi(i) axis to hinge axis
(deg) Percentage Progress
LEU-230
ARG-231
3.4
2.8
-3.7
7.3
25.1
26.0
-29.0
ARG-231
ASP-232
4.1
3.9
-2.8
-8.6
68.1
68.1
68.7
ASP-232
ASN-233
1.3
1.2
0.9
9.5
71.2
73.2
-8.5
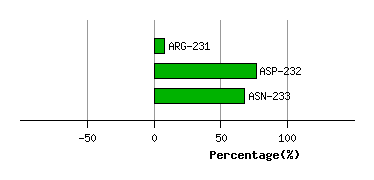
Graph shows rotational transition at bending residues and can be used
to identify hinge bending residues.
Probably only informative for interdomain rotations greater than 20 degrees
Residue
iResidue
i+1Distance of hinge axis to residue i in
(A) Distance of hinge axis to residue i in
(A) Change in
(deg) Change in
(deg) Angle of psi(i) axis to hinge axis
(deg) Angle of psi(i) axis to hinge axis
(deg) Percentage Progress
ASN-239
ASP-240
5.9
6.0
-10.5
6.6
91.6
88.4
-5.6
ASP-240
LYS-241
2.3
2.6
-0.7
4.5
33.1
35.2
12.1
LYS-241
VAL-242
2.4
2.8
-0.9
-6.7
106.0
107.8
-3.0
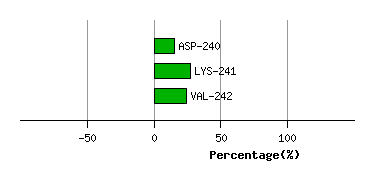
Graph shows rotational transition at bending residues and can be used
to identify hinge bending residues.
Probably only informative for interdomain rotations greater than 20 degrees
Residue
iResidue
i+1Distance of hinge axis to residue i in
(A) Distance of hinge axis to residue i in
(A) Change in
(deg) Change in
(deg) Angle of psi(i) axis to hinge axis
(deg) Angle of psi(i) axis to hinge axis
(deg) Percentage Progress
LEU-266
ILE-267
9.2
8.3
-5.9
0.8
65.9
67.1
74.5
ILE-267
ILE-268
10.5
9.8
16.8
-16.6
167.1
166.1
-4.0
ILE-268
SER-269
10.6
10.4
-32.4
41.3
82.2
89.9
-57.5
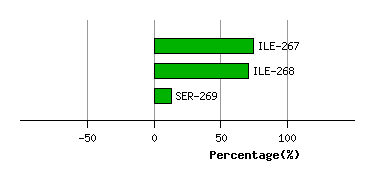
Graph shows rotational transition at bending residues and can be used
to identify hinge bending residues.
Probably only informative for interdomain rotations greater than 20 degrees
Residue
iResidue
i+1Distance of hinge axis to residue i in
(A) Distance of hinge axis to residue i in
(A) Change in
(deg) Change in
(deg) Angle of psi(i) axis to hinge axis
(deg) Angle of psi(i) axis to hinge axis
(deg) Percentage Progress
ALA-398
THR-399
8.5
7.7
-9.8
4.3
45.2
45.2
26.3
THR-399
ILE-400
7.3
6.6
4.7
-16.5
111.9
112.3
20.9
ILE-400
THR-401
4.4
3.7
0.6
-13.5
124.3
117.8
17.2
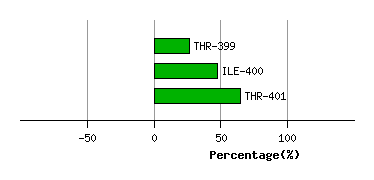
Graph shows rotational transition at bending residues and can be used
to identify hinge bending residues.
Probably only informative for interdomain rotations greater than 20 degrees
Residue
iResidue
i+1Distance of hinge axis to residue i in
(A) Distance of hinge axis to residue i in
(A) Change in
(deg) Change in
(deg) Angle of psi(i) axis to hinge axis
(deg) Angle of psi(i) axis to hinge axis
(deg) Percentage Progress
LYS-639
THR-640
5.5
5.2
-7.7
9.9
96.0
94.9
17.8
THR-640
LEU-641
5.0
4.5
-9.6
11.9
30.9
27.3
-6.0
LEU-641
MET-642
6.9
6.2
-1.0
-2.1
46.5
53.0
21.4
MET-642
GLU-643
4.0
3.3
-7.8
8.7
83.1
84.7
22.3
MET-642
GLU-643
4.0
3.3
-7.8
8.7
83.1
84.7
22.3
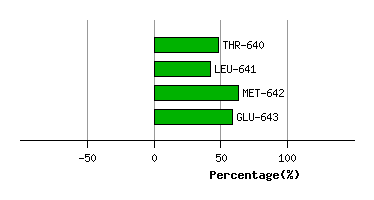
Graph shows rotational transition at bending residues and can be used
to identify hinge bending residues.
Probably only informative for interdomain rotations greater than 20 degrees
Residue
iResidue
i+1Distance of hinge axis to residue i in
(A) Distance of hinge axis to residue i in
(A) Change in
(deg) Change in
(deg) Angle of psi(i) axis to hinge axis
(deg) Angle of psi(i) axis to hinge axis
(deg) Percentage Progress
MET-642
GLU-643
4.0
3.3
-7.8
8.7
83.1
84.7
22.3
MET-642
GLU-643
4.0
3.3
-7.8
8.7
83.1
84.7
22.3
GLU-643
MET-644
2.2
1.5
-7.1
4.1
115.6
118.0
-14.5
MET-644
ASP-645
5.8
5.0
-2.0
6.7
173.2
173.4
25.5
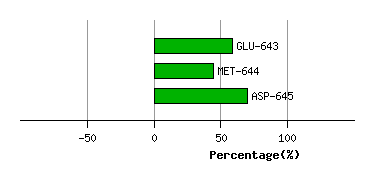
Graph shows rotational transition at bending residues and can be used
to identify hinge bending residues.
Probably only informative for interdomain rotations greater than 20 degrees
Residue
iResidue
i+1Distance of hinge axis to residue i in
(A) Distance of hinge axis to residue i in
(A) Change in
(deg) Change in
(deg) Angle of psi(i) axis to hinge axis
(deg) Angle of psi(i) axis to hinge axis
(deg) Percentage Progress
ASP-649
LYS-650
4.4
4.4
-7.7
12.4
79.8
80.3
8.8
LYS-650
GLN-651
7.1
7.5
-9.1
3.8
58.2
54.2
38.3
GLN-651
ARG-652
9.5
9.7
-12.1
12.5
18.8
19.9
6.6
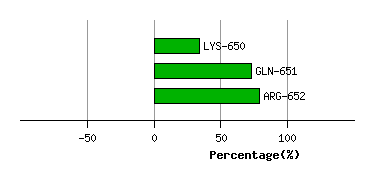
Graph shows rotational transition at bending residues and can be used
to identify hinge bending residues.
Probably only informative for interdomain rotations greater than 20 degrees
Residue
iResidue
i+1Distance of hinge axis to residue i in
(A) Distance of hinge axis to residue i in
(A) Change in
(deg) Change in
(deg) Angle of psi(i) axis to hinge axis
(deg) Angle of psi(i) axis to hinge axis
(deg) Percentage Progress
ASP-785
PRO-786
7.6
6.7
-25.7
22.9
150.7
153.0
-9.9
PRO-786
ILE-787
9.2
8.3
-12.3
-1.4
136.6
137.9
-115.8
ILE-787
VAL-788
7.1
7.0
7.1
-1.3
88.2
92.6
6.5
VAL-788
GLU-789
9.7
9.8
2.5
8.9
69.4
73.8
45.8
GLU-789
PHE-790
12.5
12.4
-10.1
0.2
168.7
177.5
-59.3
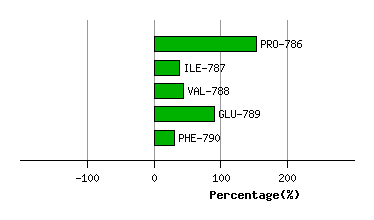
Graph shows rotational transition at bending residues and can be used
to identify hinge bending residues.
Probably only informative for interdomain rotations greater than 20 degrees