DNA Helicase Uvsw
(All numbering and residues are taken from first PDB file)
![]()
![]()
Bending Residue Dihedral Analysis
Residue
iResidue
i+1Distance of hinge axis to residue i in
(A) Distance of hinge axis to residue i in
(A) Change in
(deg) Change in
(deg) Angle of psi(i) axis to hinge axis
(deg) Angle of psi(i) axis to hinge axis
(deg) Percentage Progress
PHE-29
SER-30
5.7
5.9
6.5
6.3
46.8
42.6
68.8
SER-30
PHE-31
6.0
6.3
-4.1
1.9
150.6
146.6
-3.1
PHE-31
GLU-32
5.6
5.5
-2.4
0.8
132.9
136.1
-18.2
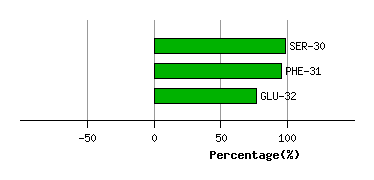
Graph shows rotational transition at bending residues and can be used
to identify hinge bending residues.
Probably only informative for interdomain rotations greater than 20 degrees
Residue
iResidue
i+1Distance of hinge axis to residue i in
(A) Distance of hinge axis to residue i in
(A) Change in
(deg) Change in
(deg) Angle of psi(i) axis to hinge axis
(deg) Angle of psi(i) axis to hinge axis
(deg) Percentage Progress
ILE-51
ARG-52
6.1
6.2
9.1
-10.6
29.8
29.8
-34.1
ARG-52
LEU-53
6.4
6.2
15.2
-6.0
56.7
56.7
69.3
LEU-53
LEU-54
3.3
3.4
4.3
6.3
15.7
13.4
73.7
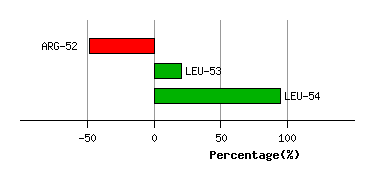
Graph shows rotational transition at bending residues and can be used
to identify hinge bending residues.
Probably only informative for interdomain rotations greater than 20 degrees
Residue
iResidue
i+1Distance of hinge axis to residue i in
(A) Distance of hinge axis to residue i in
(A) Change in
(deg) Change in
(deg) Angle of psi(i) axis to hinge axis
(deg) Angle of psi(i) axis to hinge axis
(deg) Percentage Progress
ARG-263
ASP-264
9.3
9.4
17.2
-40.3
112.7
115.9
72.7
ASP-264
GLY-265
11.0
10.1
35.9
8.0
70.8
46.4
106.0
GLY-265
LYS-266
9.8
9.1
6.5
-51.4
82.5
92.9
-10.5
LYS-266
ALA-267
6.0
5.6
5.4
-16.1
140.9
161.4
56.1
ALA-267
ASN-268
4.5
4.8
21.5
10.5
141.9
130.3
-172.1
ASN-268
ILE-269
2.2
2.6
6.6
-18.3
121.9
121.2
18.7
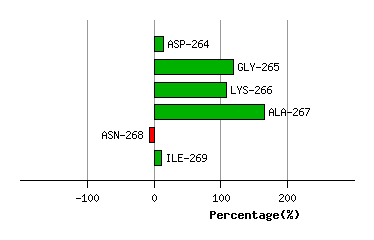
Graph shows rotational transition at bending residues and can be used
to identify hinge bending residues.
Probably only informative for interdomain rotations greater than 20 degrees