DNA Ligase
(All numbering and residues are taken from first PDB file)
![]()
![]()
Bending Residue Dihedral Analysis
Residue
iResidue
i+1Distance of hinge axis to residue i in
(A) Distance of hinge axis to residue i in
(A) Change in
(deg) Change in
(deg) Angle of psi(i) axis to hinge axis
(deg) Angle of psi(i) axis to hinge axis
(deg) Percentage Progress
TYR-268
ARG-269
41.2
40.6
-6.5
7.3
17.0
12.2
10.1
ARG-269
ARG-270
41.5
41.0
24.0
-32.3
104.6
109.9
0.0
ARG-270
GLY-271
43.6
42.7
-9.3
12.0
105.1
107.1
127.5

Graph shows rotational transition at bending residues and can be used
to identify hinge bending residues.
Probably only informative for interdomain rotations greater than 20 degrees
Residue
iResidue
i+1Distance of hinge axis to residue i in
(A) Distance of hinge axis to residue i in
(A) Change in
(deg) Change in
(deg) Angle of psi(i) axis to hinge axis
(deg) Angle of psi(i) axis to hinge axis
(deg) Percentage Progress
ARG-275
HIS-276
36.0
36.6
-26.6
67.9
98.8
110.0
619.2
HIS-276
ALA-277
35.3
35.8
-43.3
27.4
99.9
87.8
47.5
ALA-277
LEU-278
38.8
39.2
-2.2
6.1
29.9
26.8
-222.4
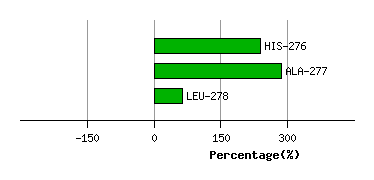
Graph shows rotational transition at bending residues and can be used
to identify hinge bending residues.
Probably only informative for interdomain rotations greater than 20 degrees
Residue
iResidue
i+1Distance of hinge axis to residue i in
(A) Distance of hinge axis to residue i in
(A) Change in
(deg) Change in
(deg) Angle of psi(i) axis to hinge axis
(deg) Angle of psi(i) axis to hinge axis
(deg) Percentage Progress
GLU-281
ALA-282
31.8
32.2
26.1
-15.2
52.2
45.8
266.1
ALA-282
ASP-283
33.2
33.0
11.8
5.5
114.6
112.8
-258.2
ASP-283
GLY-284
31.1
30.8
-11.8
-8.9
104.2
95.8
-197.4
GLY-284
VAL-285
33.8
33.8
-10.4
20.8
121.3
129.8
251.6
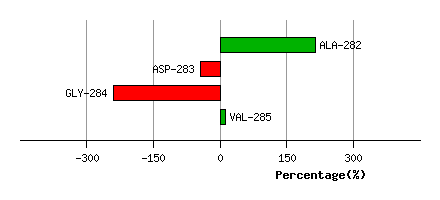
Graph shows rotational transition at bending residues and can be used
to identify hinge bending residues.
Probably only informative for interdomain rotations greater than 20 degrees
Residue
iResidue
i+1Distance of hinge axis to residue i in
(A) Distance of hinge axis to residue i in
(A) Change in
(deg) Change in
(deg) Angle of psi(i) axis to hinge axis
(deg) Angle of psi(i) axis to hinge axis
(deg) Percentage Progress
TYR-311
LYS-312
35.6
35.0
-13.3
18.1
52.1
52.3
-47.9
LYS-312
PHE-313
32.8
32.1
11.8
-7.1
173.3
168.3
-155.9
PHE-313
PRO-314
32.8
32.2
9.3
-17.0
109.2
115.7
157.6
PRO-314
ALA-315
30.5
30.5
-70.8
10.3
86.2
72.5
481.1
ALA-315
GLU-316
26.8
27.4
-8.9
17.6
19.8
58.0
-282.5
GLU-316
GLU-317
25.9
25.5
52.7
-7.4
94.6
89.6
-24.9
GLU-317
LYS-318
22.1
21.7
-58.1
39.8
47.8
52.4
371.7
LYS-318
GLU-319
20.4
20.8
-5.7
0.3
81.4
72.8
139.6
GLU-319
THR-320
17.0
17.3
24.8
1.8
12.9
8.9
867.3
GLU-319
THR-320
17.0
17.3
24.8
1.8
12.9
8.9
867.3
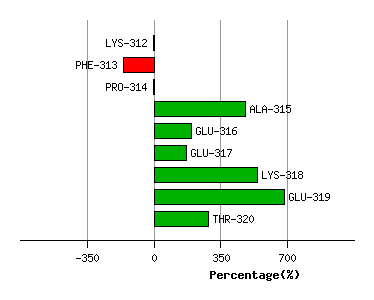
Graph shows rotational transition at bending residues and can be used
to identify hinge bending residues.
Probably only informative for interdomain rotations greater than 20 degrees
Residue
iResidue
i+1Distance of hinge axis to residue i in
(A) Distance of hinge axis to residue i in
(A) Change in
(deg) Change in
(deg) Angle of psi(i) axis to hinge axis
(deg) Angle of psi(i) axis to hinge axis
(deg) Percentage Progress
GLU-319
THR-320
17.0
17.3
24.8
1.8
12.9
8.9
867.3
GLU-319
THR-320
17.0
17.3
24.8
1.8
12.9
8.9
867.3
THR-320
ARG-321
15.0
15.4
14.1
-16.5
89.2
86.9
-82.6
ARG-321
LEU-322
11.6
12.0
-6.8
9.1
104.6
108.9
-92.8
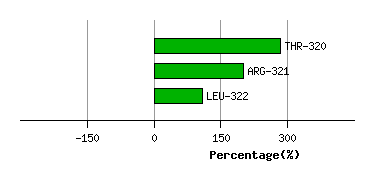
Graph shows rotational transition at bending residues and can be used
to identify hinge bending residues.
Probably only informative for interdomain rotations greater than 20 degrees
Residue
iResidue
i+1Distance of hinge axis to residue i in
(A) Distance of hinge axis to residue i in
(A) Change in
(deg) Change in
(deg) Angle of psi(i) axis to hinge axis
(deg) Angle of psi(i) axis to hinge axis
(deg) Percentage Progress
ARG-331
THR-332
31.6
31.7
-7.0
-4.4
119.0
118.5
-71.4
THR-332
GLY-333
31.5
31.2
4.0
-12.5
106.5
109.2
137.3
GLY-333
ARG-334
29.2
28.9
6.6
0.9
71.2
67.5
64.4
ARG-334
VAL-335
26.0
25.8
18.4
-17.3
51.1
47.5
49.8
ARG-334
VAL-335
26.0
25.8
18.4
-17.3
51.1
47.5
49.8
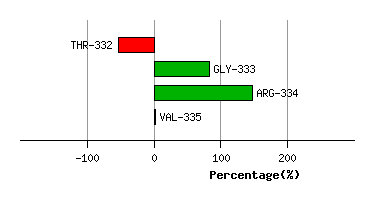
Graph shows rotational transition at bending residues and can be used
to identify hinge bending residues.
Probably only informative for interdomain rotations greater than 20 degrees
Residue
iResidue
i+1Distance of hinge axis to residue i in
(A) Distance of hinge axis to residue i in
(A) Change in
(deg) Change in
(deg) Angle of psi(i) axis to hinge axis
(deg) Angle of psi(i) axis to hinge axis
(deg) Percentage Progress
ARG-334
VAL-335
26.0
25.8
18.4
-17.3
51.1
47.5
49.8
ARG-334
VAL-335
26.0
25.8
18.4
-17.3
51.1
47.5
49.8
VAL-335
THR-336
22.9
22.6
-3.7
-4.7
60.5
59.9
130.1
THR-336
PRO-337
21.4
21.2
-11.3
16.3
115.2
116.8
89.0
PRO-337
VAL-338
17.8
17.7
6.7
-11.7
80.1
81.9
-105.4
VAL-338
GLY-339
17.5
17.6
-15.2
12.1
107.1
113.4
-106.6
GLY-339
VAL-340
14.7
14.7
15.0
-6.8
48.7
50.8
161.4
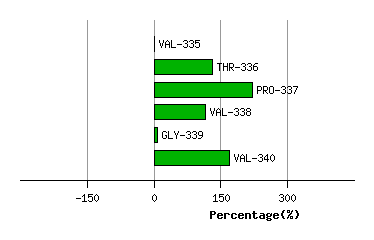
Graph shows rotational transition at bending residues and can be used
to identify hinge bending residues.
Probably only informative for interdomain rotations greater than 20 degrees
Residue
iResidue
i+1Distance of hinge axis to residue i in
(A) Distance of hinge axis to residue i in
(A) Change in
(deg) Change in
(deg) Angle of psi(i) axis to hinge axis
(deg) Angle of psi(i) axis to hinge axis
(deg) Percentage Progress
GLU-342
PRO-343
15.1
15.6
-12.9
18.7
99.6
101.4
-148.0
PRO-343
VAL-344
18.9
19.4
-43.1
36.9
127.1
127.6
-15.7
VAL-344
PHE-345
20.7
20.7
-10.3
14.0
102.0
103.4
144.8
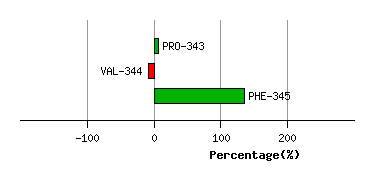
Graph shows rotational transition at bending residues and can be used
to identify hinge bending residues.
Probably only informative for interdomain rotations greater than 20 degrees
Residue
iResidue
i+1Distance of hinge axis to residue i in
(A) Distance of hinge axis to residue i in
(A) Change in
(deg) Change in
(deg) Angle of psi(i) axis to hinge axis
(deg) Angle of psi(i) axis to hinge axis
(deg) Percentage Progress
VAL-351
SER-352
22.1
22.6
-22.6
45.9
120.3
115.1
379.0
SER-352
ARG-353
19.2
19.9
-18.6
16.7
80.0
67.5
25.9
ARG-353
VAL-354
19.1
19.4
30.2
-17.8
157.9
166.8
-305.1
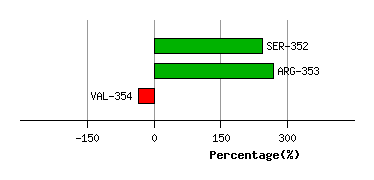
Graph shows rotational transition at bending residues and can be used
to identify hinge bending residues.
Probably only informative for interdomain rotations greater than 20 degrees
Residue
iResidue
i+1Distance of hinge axis to residue i in
(A) Distance of hinge axis to residue i in
(A) Change in
(deg) Change in
(deg) Angle of psi(i) axis to hinge axis
(deg) Angle of psi(i) axis to hinge axis
(deg) Percentage Progress
THR-355
LEU-356
19.4
19.3
-5.7
1.8
129.2
135.3
-62.7
LEU-356
HIS-357
16.7
16.6
10.6
-5.0
48.8
53.4
137.9
HIS-357
ASN-358
19.6
19.5
7.8
-12.6
93.5
96.0
72.3
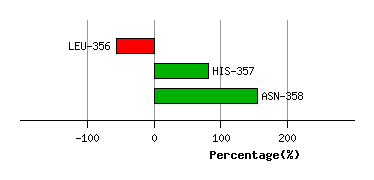
Graph shows rotational transition at bending residues and can be used
to identify hinge bending residues.
Probably only informative for interdomain rotations greater than 20 degrees
Residue
iResidue
i+1Distance of hinge axis to residue i in
(A) Distance of hinge axis to residue i in
(A) Change in
(deg) Change in
(deg) Angle of psi(i) axis to hinge axis
(deg) Angle of psi(i) axis to hinge axis
(deg) Percentage Progress
TYR-361
ILE-362
14.9
14.7
-16.6
6.9
117.6
115.2
-68.1
ILE-362
GLU-363
12.3
12.0
2.1
4.2
123.1
121.6
-76.7
GLU-363
GLU-364
10.9
10.9
3.3
-12.2
140.5
140.3
286.5
GLU-364
LEU-365
10.7
10.5
13.7
-11.0
76.5
78.1
-162.6
LEU-365
ASP-366
9.8
9.5
3.9
-3.9
56.7
53.8
-134.5
ASP-366
ILE-367
6.9
6.8
8.5
-5.9
30.0
29.3
-2.6
ILE-367
ARG-368
8.3
7.8
12.6
-6.4
41.5
41.0
389.2
ARG-368
ILE-369
5.9
5.5
-25.8
9.3
147.1
139.0
-486.6
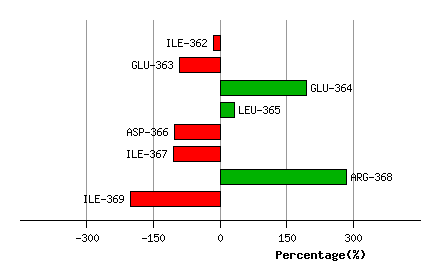
Graph shows rotational transition at bending residues and can be used
to identify hinge bending residues.
Probably only informative for interdomain rotations greater than 20 degrees
Residue
iResidue
i+1Distance of hinge axis to residue i in
(A) Distance of hinge axis to residue i in
(A) Change in
(deg) Change in
(deg) Angle of psi(i) axis to hinge axis
(deg) Angle of psi(i) axis to hinge axis
(deg) Percentage Progress
VAL-373
LEU-374
12.2
12.1
28.9
-29.1
100.9
99.6
22.8
LEU-374
VAL-375
15.4
15.5
1.9
-2.5
86.9
89.0
25.4
VAL-375
HIS-376
17.9
18.2
12.5
-14.9
111.4
109.6
144.2
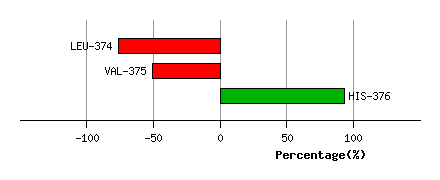
Graph shows rotational transition at bending residues and can be used
to identify hinge bending residues.
Probably only informative for interdomain rotations greater than 20 degrees
Residue
iResidue
i+1Distance of hinge axis to residue i in
(A) Distance of hinge axis to residue i in
(A) Change in
(deg) Change in
(deg) Angle of psi(i) axis to hinge axis
(deg) Angle of psi(i) axis to hinge axis
(deg) Percentage Progress
PRO-383
GLU-384
22.5
23.0
-2.1
15.5
101.9
95.2
150.1
GLU-384
VAL-385
19.2
19.7
-1.7
9.2
108.0
106.3
1.8
VAL-385
LEU-386
15.7
16.2
27.5
-20.2
5.2
6.5
269.9
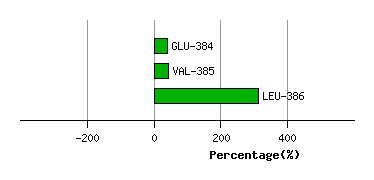
Graph shows rotational transition at bending residues and can be used
to identify hinge bending residues.
Probably only informative for interdomain rotations greater than 20 degrees
Residue
iResidue
i+1Distance of hinge axis to residue i in
(A) Distance of hinge axis to residue i in
(A) Change in
(deg) Change in
(deg) Angle of psi(i) axis to hinge axis
(deg) Angle of psi(i) axis to hinge axis
(deg) Percentage Progress
CYS-406
PRO-407
23.8
23.5
5.2
-3.3
29.7
26.4
72.8
PRO-407
GLU-408
22.2
22.1
17.8
2.5
61.4
65.8
456.1
GLU-408
CYS-409
25.6
25.7
-56.2
41.4
103.3
113.8
-301.2
CYS-409
GLY-410
27.9
27.9
17.4
-4.0
78.7
79.0
-31.7
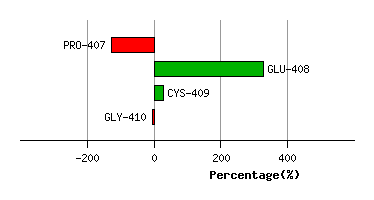
Graph shows rotational transition at bending residues and can be used
to identify hinge bending residues.
Probably only informative for interdomain rotations greater than 20 degrees
Residue
iResidue
i+1Distance of hinge axis to residue i in
(A) Distance of hinge axis to residue i in
(A) Change in
(deg) Change in
(deg) Angle of psi(i) axis to hinge axis
(deg) Angle of psi(i) axis to hinge axis
(deg) Percentage Progress
ARG-412
LEU-413
26.1
26.4
-6.6
-3.5
29.3
33.0
340.8
LEU-413
VAL-414
24.9
25.0
-7.8
14.5
36.5
39.2
-116.2
VAL-414
LYS-415
26.0
25.9
28.7
-27.4
141.4
137.5
18.4
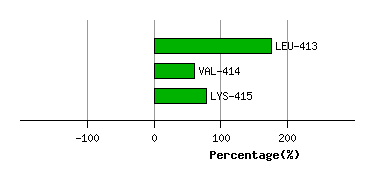
Graph shows rotational transition at bending residues and can be used
to identify hinge bending residues.
Probably only informative for interdomain rotations greater than 20 degrees
Residue
iResidue
i+1Distance of hinge axis to residue i in
(A) Distance of hinge axis to residue i in
(A) Change in
(deg) Change in
(deg) Angle of psi(i) axis to hinge axis
(deg) Angle of psi(i) axis to hinge axis
(deg) Percentage Progress
LYS-418
VAL-419
22.0
22.0
-8.9
4.9
29.9
28.4
160.2
VAL-419
HIS-420
22.3
22.4
14.2
-12.3
141.9
141.7
-139.9
HIS-420
ARG-421
22.5
22.7
-4.3
0.1
64.0
65.1
77.6
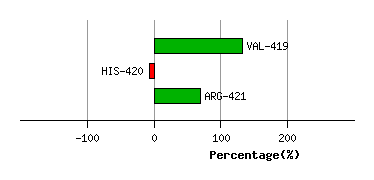
Graph shows rotational transition at bending residues and can be used
to identify hinge bending residues.
Probably only informative for interdomain rotations greater than 20 degrees