6-Phosphofructokinase Isozyme 2
(All numbering and residues are taken from first PDB file)
![]()
![]()
Bending Residue Dihedral Analysis
Residue
iResidue
i+1Distance of hinge axis to residue i in
(A) Distance of hinge axis to residue i in
(A) Change in
(deg) Change in
(deg) Angle of psi(i) axis to hinge axis
(deg) Angle of psi(i) axis to hinge axis
(deg) Percentage Progress
ASN-43
VAL-44
8.6
8.8
-5.1
2.5
51.6
46.7
9.0
VAL-44
ALA-45
7.4
7.5
-3.6
-3.6
28.8
28.4
68.5
ALA-45
ARG-46
7.7
7.8
4.1
2.9
91.7
91.9
-12.4
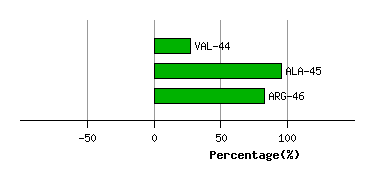
Graph shows rotational transition at bending residues and can be used
to identify hinge bending residues.
Probably only informative for interdomain rotations greater than 20 degrees
Residue
iResidue
i+1Distance of hinge axis to residue i in
(A) Distance of hinge axis to residue i in
(A) Change in
(deg) Change in
(deg) Angle of psi(i) axis to hinge axis
(deg) Angle of psi(i) axis to hinge axis
(deg) Percentage Progress
GLY-53
SER-54
12.1
12.1
-1.1
0.6
89.1
86.4
69.1
SER-54
ALA-55
9.4
9.4
-8.7
11.4
67.6
70.1
10.4
ALA-55
THR-56
6.5
6.4
9.0
-4.5
103.1
104.1
-7.3
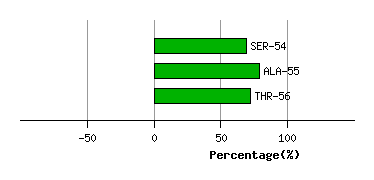
Graph shows rotational transition at bending residues and can be used
to identify hinge bending residues.
Probably only informative for interdomain rotations greater than 20 degrees
Residue
iResidue
i+1Distance of hinge axis to residue i in
(A) Distance of hinge axis to residue i in
(A) Change in
(deg) Change in
(deg) Angle of psi(i) axis to hinge axis
(deg) Angle of psi(i) axis to hinge axis
(deg) Percentage Progress
LEU-113
ASN-114
14.3
14.4
-14.2
2.2
90.9
89.4
10.5
ASN-114
GLU-115
17.7
17.7
2.0
4.1
139.0
140.9
-100.1
GLU-115
ASP-116
18.6
18.7
-7.0
-10.9
26.6
23.6
223.8
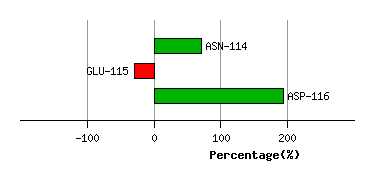
Graph shows rotational transition at bending residues and can be used
to identify hinge bending residues.
Probably only informative for interdomain rotations greater than 20 degrees
Residue
iResidue
i+1Distance of hinge axis to residue i in
(A) Distance of hinge axis to residue i in
(A) Change in
(deg) Change in
(deg) Angle of psi(i) axis to hinge axis
(deg) Angle of psi(i) axis to hinge axis
(deg) Percentage Progress
GLU-117
PHE-118
16.1
16.4
1.4
-2.4
77.6
79.5
6.5
PHE-118
ARG-119
14.1
14.0
-1.7
1.8
154.2
155.0
-3.0
ARG-119
GLN-120
16.1
15.9
2.9
5.6
43.1
43.5
116.3
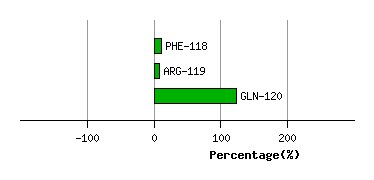
Graph shows rotational transition at bending residues and can be used
to identify hinge bending residues.
Probably only informative for interdomain rotations greater than 20 degrees
Residue
iResidue
i+1Distance of hinge axis to residue i in
(A) Distance of hinge axis to residue i in
(A) Change in
(deg) Change in
(deg) Angle of psi(i) axis to hinge axis
(deg) Angle of psi(i) axis to hinge axis
(deg) Percentage Progress
GLN-124
VAL-125
10.1
10.1
10.7
-15.5
99.3
95.4
22.7
VAL-125
LEU-126
7.8
7.7
4.8
-0.9
142.7
137.9
-51.4
LEU-126
GLU-127
10.1
10.0
-4.4
5.8
27.4
22.8
-6.5
GLU-127
ILE-128
8.9
8.9
-5.4
4.0
72.5
73.2
-37.0
ILE-128
GLU-129
5.5
5.5
-0.7
-8.8
45.2
51.1
83.3
GLU-129
SER-130
5.2
5.7
8.9
1.0
73.2
73.4
32.1
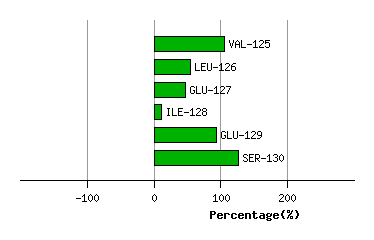
Graph shows rotational transition at bending residues and can be used
to identify hinge bending residues.
Probably only informative for interdomain rotations greater than 20 degrees
Residue
iResidue
i+1Distance of hinge axis to residue i in
(A) Distance of hinge axis to residue i in
(A) Change in
(deg) Change in
(deg) Angle of psi(i) axis to hinge axis
(deg) Angle of psi(i) axis to hinge axis
(deg) Percentage Progress
LEU-134
VAL-135
3.3
3.3
7.4
-6.8
153.5
151.8
26.9
VAL-135
ILE-136
3.1
3.1
2.8
-1.6
133.7
133.2
-34.0
ILE-136
SER-137
2.8
2.8
2.7
-9.3
147.3
147.6
70.3
SER-137
GLY-138
1.8
1.6
1.2
-2.1
134.4
129.9
-26.9
GLY-138
SER-139
0.3
0.6
-15.3
12.1
54.3
56.0
-19.4
SER-139
LEU-140
2.2
2.0
6.0
1.7
69.1
67.6
46.0
LEU-140
PRO-141
6.0
5.8
12.0
9.8
123.5
119.9
-184.1
PRO-141
PRO-142
8.4
8.5
-11.1
-7.5
69.6
53.2
104.4
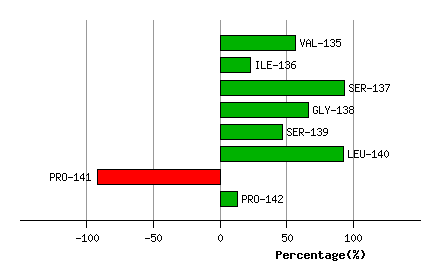
Graph shows rotational transition at bending residues and can be used
to identify hinge bending residues.
Probably only informative for interdomain rotations greater than 20 degrees
Residue
iResidue
i+1Distance of hinge axis to residue i in
(A) Distance of hinge axis to residue i in
(A) Change in
(deg) Change in
(deg) Angle of psi(i) axis to hinge axis
(deg) Angle of psi(i) axis to hinge axis
(deg) Percentage Progress
LEU-149
THR-150
11.4
10.9
5.7
-3.4
58.7
64.5
11.2
THR-150
GLN-151
13.7
13.1
-5.4
7.2
151.4
150.8
18.9
GLN-151
LEU-152
15.5
15.2
-1.0
3.2
134.2
137.3
18.9
LEU-152
ILE-153
12.3
12.0
2.8
-1.2
114.4
114.0
-4.1
LEU-152
ILE-153
12.3
12.0
2.8
-1.2
114.4
114.0
-4.1
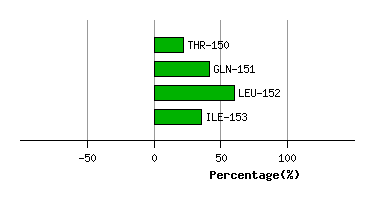
Graph shows rotational transition at bending residues and can be used
to identify hinge bending residues.
Probably only informative for interdomain rotations greater than 20 degrees
Residue
iResidue
i+1Distance of hinge axis to residue i in
(A) Distance of hinge axis to residue i in
(A) Change in
(deg) Change in
(deg) Angle of psi(i) axis to hinge axis
(deg) Angle of psi(i) axis to hinge axis
(deg) Percentage Progress
LEU-152
ILE-153
12.3
12.0
2.8
-1.2
114.4
114.0
-4.1
LEU-152
ILE-153
12.3
12.0
2.8
-1.2
114.4
114.0
-4.1
ILE-153
SER-154
11.2
11.1
-0.7
-4.6
50.3
50.8
88.5
SER-154
ALA-155
14.7
14.6
-6.8
9.8
28.6
29.3
-62.4
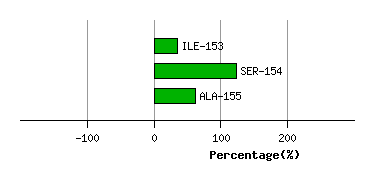
Graph shows rotational transition at bending residues and can be used
to identify hinge bending residues.
Probably only informative for interdomain rotations greater than 20 degrees
Residue
iResidue
i+1Distance of hinge axis to residue i in
(A) Distance of hinge axis to residue i in
(A) Change in
(deg) Change in
(deg) Angle of psi(i) axis to hinge axis
(deg) Angle of psi(i) axis to hinge axis
(deg) Percentage Progress
GLN-159
GLY-160
12.6
12.6
-4.5
3.8
101.2
100.8
17.0
GLY-160
ILE-161
11.1
11.1
-9.4
4.3
63.9
62.7
-2.4
ILE-161
ARG-162
8.3
8.2
-6.8
6.6
50.9
49.3
-8.5
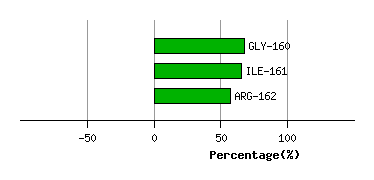
Graph shows rotational transition at bending residues and can be used
to identify hinge bending residues.
Probably only informative for interdomain rotations greater than 20 degrees
Residue
iResidue
i+1Distance of hinge axis to residue i in
(A) Distance of hinge axis to residue i in
(A) Change in
(deg) Change in
(deg) Angle of psi(i) axis to hinge axis
(deg) Angle of psi(i) axis to hinge axis
(deg) Percentage Progress
ASP-166
SER-167
6.1
6.2
-2.6
-3.4
134.1
137.4
-32.6
SER-167
SER-168
5.2
5.4
-10.5
7.7
150.2
143.1
-69.2
SER-168
GLY-169
6.4
6.9
7.6
3.8
67.3
66.9
119.9
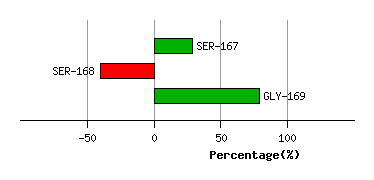
Graph shows rotational transition at bending residues and can be used
to identify hinge bending residues.
Probably only informative for interdomain rotations greater than 20 degrees