Endo-1,4-Beta-Xylanase A
(All numbering and residues are taken from first PDB file)
![]()
![]()
Bending Residue Dihedral Analysis
Residue
iResidue
i+1Distance of hinge axis to residue i in
(A) Distance of hinge axis to residue i in
(A) Change in
(deg) Change in
(deg) Angle of psi(i) axis to hinge axis
(deg) Angle of psi(i) axis to hinge axis
(deg) Percentage Progress
THR-44
GLY-45
4.0
4.0
-9.5
1.6
12.0
12.3
85.3
GLY-45
SER-46
3.0
2.8
-0.9
-6.1
80.9
79.5
-0.2
SER-46
PRO-47
5.5
5.0
-5.6
3.9
25.8
22.5
19.7
PRO-47
PHE-48
6.2
5.5
-4.0
6.2
48.3
52.9
-77.7
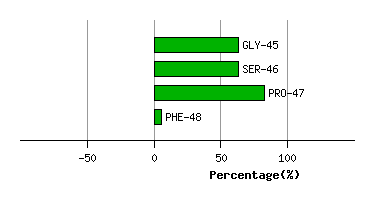
Graph shows rotational transition at bending residues and can be used
to identify hinge bending residues.
Probably only informative for interdomain rotations greater than 20 degrees
Residue
iResidue
i+1Distance of hinge axis to residue i in
(A) Distance of hinge axis to residue i in
(A) Change in
(deg) Change in
(deg) Angle of psi(i) axis to hinge axis
(deg) Angle of psi(i) axis to hinge axis
(deg) Percentage Progress
LEU-68
TYR-69
6.5
6.6
-1.5
0.5
122.1
122.2
18.1
TYR-69
GLY-70
6.7
6.9
-1.8
3.6
146.9
147.8
34.3
GLY-70
TRP-71
4.7
4.9
-3.1
3.3
106.9
109.3
-3.2
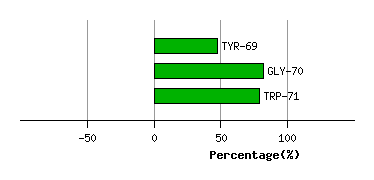
Graph shows rotational transition at bending residues and can be used
to identify hinge bending residues.
Probably only informative for interdomain rotations greater than 20 degrees
Residue
iResidue
i+1Distance of hinge axis to residue i in
(A) Distance of hinge axis to residue i in
(A) Change in
(deg) Change in
(deg) Angle of psi(i) axis to hinge axis
(deg) Angle of psi(i) axis to hinge axis
(deg) Percentage Progress
TYR-79
TYR-80
6.6
6.7
2.7
-1.1
66.7
65.8
14.5
TYR-80
VAL-81
6.6
6.8
-1.1
1.0
144.6
144.3
-19.0
VAL-81
VAL-82
5.0
5.2
1.4
0.2
70.6
69.4
30.1

Graph shows rotational transition at bending residues and can be used
to identify hinge bending residues.
Probably only informative for interdomain rotations greater than 20 degrees
Residue
iResidue
i+1Distance of hinge axis to residue i in
(A) Distance of hinge axis to residue i in
(A) Change in
(deg) Change in
(deg) Angle of psi(i) axis to hinge axis
(deg) Angle of psi(i) axis to hinge axis
(deg) Percentage Progress
GLY-96
THR-97
10.9
10.8
1.2
-1.4
94.9
94.6
-8.4
THR-97
VAL-98
7.2
7.1
-1.7
-2.0
105.6
110.8
12.7
VAL-98
LYS-99
4.4
4.2
-3.8
0.7
67.2
65.3
62.6
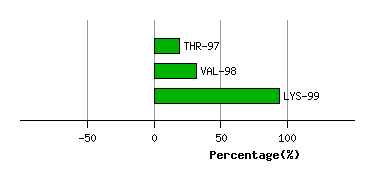
Graph shows rotational transition at bending residues and can be used
to identify hinge bending residues.
Probably only informative for interdomain rotations greater than 20 degrees
Residue
iResidue
i+1Distance of hinge axis to residue i in
(A) Distance of hinge axis to residue i in
(A) Change in
(deg) Change in
(deg) Angle of psi(i) axis to hinge axis
(deg) Angle of psi(i) axis to hinge axis
(deg) Percentage Progress
THR-104
TYR-105
2.5
2.3
-3.5
2.2
48.0
52.6
-7.7
TYR-105
ASP-106
4.5
4.6
5.2
-0.9
87.1
86.2
8.2
ASP-106
ILE-107
7.9
7.9
-0.2
1.5
14.9
14.9
-23.9
ILE-107
TYR-108
8.7
8.8
-0.8
2.4
75.4
76.6
17.2
TYR-108
THR-109
11.8
11.8
1.8
6.1
164.5
165.4
-69.6
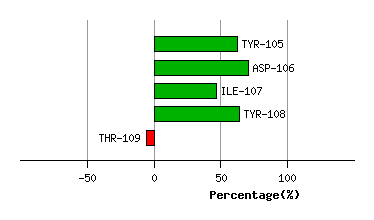
Graph shows rotational transition at bending residues and can be used
to identify hinge bending residues.
Probably only informative for interdomain rotations greater than 20 degrees
Residue
iResidue
i+1Distance of hinge axis to residue i in
(A) Distance of hinge axis to residue i in
(A) Change in
(deg) Change in
(deg) Angle of psi(i) axis to hinge axis
(deg) Angle of psi(i) axis to hinge axis
(deg) Percentage Progress
TYR-128
TRP-129
9.2
9.4
5.6
-7.8
60.2
59.4
-33.4
TRP-129
SER-130
8.4
8.4
2.9
-2.5
38.9
38.2
41.7
SER-130
VAL-131
5.9
5.9
0.6
1.2
72.7
73.0
-21.3
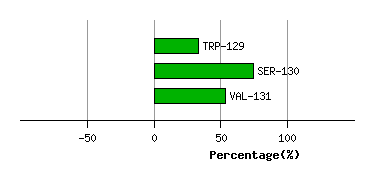
Graph shows rotational transition at bending residues and can be used
to identify hinge bending residues.
Probably only informative for interdomain rotations greater than 20 degrees
Residue
iResidue
i+1Distance of hinge axis to residue i in
(A) Distance of hinge axis to residue i in
(A) Change in
(deg) Change in
(deg) Angle of psi(i) axis to hinge axis
(deg) Angle of psi(i) axis to hinge axis
(deg) Percentage Progress
THR-143
ILE-144
9.6
9.8
-3.6
-0.8
88.7
88.0
83.7
ILE-144
THR-145
6.1
6.3
6.6
-6.2
66.5
65.0
50.0
THR-145
PHE-146
6.0
6.0
-0.2
4.9
114.7
112.0
26.6
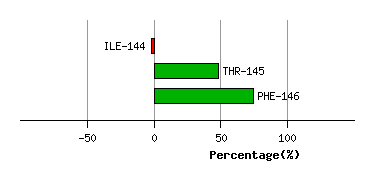
Graph shows rotational transition at bending residues and can be used
to identify hinge bending residues.
Probably only informative for interdomain rotations greater than 20 degrees
Residue
iResidue
i+1Distance of hinge axis to residue i in
(A) Distance of hinge axis to residue i in
(A) Change in
(deg) Change in
(deg) Angle of psi(i) axis to hinge axis
(deg) Angle of psi(i) axis to hinge axis
(deg) Percentage Progress
HIS-149
VAL-150
3.5
3.3
-6.4
2.5
49.7
50.1
34.0
VAL-150
ASN-151
6.0
5.6
0.4
1.2
60.4
61.3
49.2
ASN-151
ALA-152
8.9
8.5
-1.0
2.1
129.0
129.1
-28.5
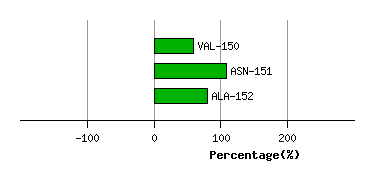
Graph shows rotational transition at bending residues and can be used
to identify hinge bending residues.
Probably only informative for interdomain rotations greater than 20 degrees
Residue
iResidue
i+1Distance of hinge axis to residue i in
(A) Distance of hinge axis to residue i in
(A) Change in
(deg) Change in
(deg) Angle of psi(i) axis to hinge axis
(deg) Angle of psi(i) axis to hinge axis
(deg) Percentage Progress
MET-158
ASN-159
11.8
12.0
-3.0
7.2
125.5
125.9
13.6
ASN-159
LEU-160
11.3
11.4
1.6
-3.6
40.8
45.1
-3.4
LEU-160
GLY-161
8.5
8.5
2.7
6.2
27.0
24.9
106.6
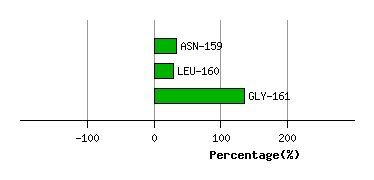
Graph shows rotational transition at bending residues and can be used
to identify hinge bending residues.
Probably only informative for interdomain rotations greater than 20 degrees
Residue
iResidue
i+1Distance of hinge axis to residue i in
(A) Distance of hinge axis to residue i in
(A) Change in
(deg) Change in
(deg) Angle of psi(i) axis to hinge axis
(deg) Angle of psi(i) axis to hinge axis
(deg) Percentage Progress
ASN-163
TRP-164
6.0
6.1
-3.8
-1.9
120.6
119.2
-7.2
TRP-164
ALA-165
2.7
2.8
2.1
-5.9
123.2
122.4
63.4
ALA-165
TYR-166
1.5
1.7
-2.6
-3.4
128.7
128.5
-54.9
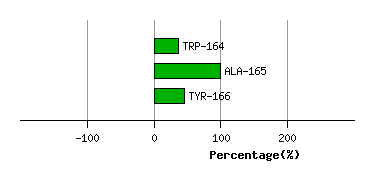
Graph shows rotational transition at bending residues and can be used
to identify hinge bending residues.
Probably only informative for interdomain rotations greater than 20 degrees