O-Acetylserine Sulfhydrylase
(All numbering and residues are taken from first PDB file)
![]()
![]()
Bending Residue Dihedral Analysis
Residue
iResidue
i+1Distance of hinge axis to residue i in
(A) Distance of hinge axis to residue i in
(A) Change in
(deg) Change in
(deg) Angle of psi(i) axis to hinge axis
(deg) Angle of psi(i) axis to hinge axis
(deg) Percentage Progress
VAL-57
LEU-58
10.9
10.8
-0.3
0.7
79.8
79.5
1.2
LEU-58
LYS-59
8.5
8.4
1.1
-6.9
64.9
64.9
-13.3
LYS-59
PRO-60
8.9
8.9
26.2
-23.2
80.7
75.3
-40.9
PRO-60
GLY-61
8.5
8.1
-0.5
23.3
134.7
135.1
78.3
GLY-61
VAL-62
5.5
4.9
-32.1
12.0
75.8
62.0
26.7
VAL-62
GLU-63
3.6
3.4
2.6
-16.2
139.2
134.5
52.4
GLU-63
LEU-64
0.5
0.5
4.9
-4.3
128.9
129.3
6.3
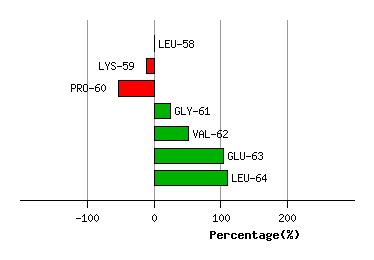
Graph shows rotational transition at bending residues and can be used
to identify hinge bending residues.
Probably only informative for interdomain rotations greater than 20 degrees
Residue
iResidue
i+1Distance of hinge axis to residue i in
(A) Distance of hinge axis to residue i in
(A) Change in
(deg) Change in
(deg) Angle of psi(i) axis to hinge axis
(deg) Angle of psi(i) axis to hinge axis
(deg) Percentage Progress
ASN-71
THR-72
4.4
4.0
-13.1
-1.1
41.0
40.8
50.3
THR-72
GLY-73
3.8
3.5
8.6
-8.2
137.2
139.7
3.2
GLY-73
ILE-74
4.0
4.0
4.2
-7.1
76.7
81.7
-13.0
ILE-74
ALA-75
3.9
3.8
5.7
4.7
92.9
98.3
-24.7
ALA-75
LEU-76
1.4
1.5
-3.2
-5.3
18.2
13.7
55.9
LEU-76
ALA-77
0.9
0.9
-0.4
-0.9
65.3
67.5
1.6
ALA-77
TYR-78
4.0
4.1
-3.8
-5.9
103.5
101.7
11.8
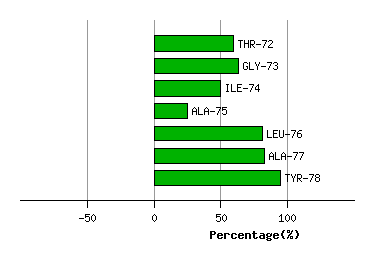
Graph shows rotational transition at bending residues and can be used
to identify hinge bending residues.
Probably only informative for interdomain rotations greater than 20 degrees
Residue
iResidue
i+1Distance of hinge axis to residue i in
(A) Distance of hinge axis to residue i in
(A) Change in
(deg) Change in
(deg) Angle of psi(i) axis to hinge axis
(deg) Angle of psi(i) axis to hinge axis
(deg) Percentage Progress
ARG-83
GLY-84
10.0
10.0
-6.2
0.0
156.1
157.3
-37.1
GLY-84
TYR-85
9.3
9.4
8.0
-4.2
59.1
55.3
24.6
TYR-85
LYS-86
5.6
5.7
-0.9
3.7
83.4
86.9
27.0
LYS-86
LEU-87
4.4
4.7
-10.3
5.4
64.6
61.3
45.3
LEU-87
THR-88
3.0
3.5
-0.2
-3.4
93.0
91.7
12.0
THR-88
LEU-89
5.5
6.0
-2.0
-1.0
42.6
44.0
6.4
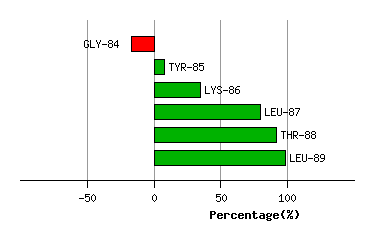
Graph shows rotational transition at bending residues and can be used
to identify hinge bending residues.
Probably only informative for interdomain rotations greater than 20 degrees
Residue
iResidue
i+1Distance of hinge axis to residue i in
(A) Distance of hinge axis to residue i in
(A) Change in
(deg) Change in
(deg) Angle of psi(i) axis to hinge axis
(deg) Angle of psi(i) axis to hinge axis
(deg) Percentage Progress
LEU-140
GLN-141
7.5
8.1
-158.4
-166.8
128.2
120.7
91.9
GLN-141
GLN-142
10.2
10.4
-21.3
4.3
152.0
151.1
-120.1
GLN-142
PHE-143
9.9
9.9
-6.0
5.1
118.1
115.2
-22.1
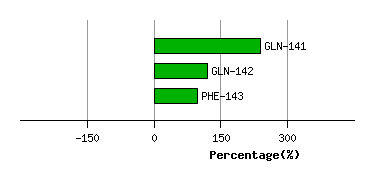
Graph shows rotational transition at bending residues and can be used
to identify hinge bending residues.
Probably only informative for interdomain rotations greater than 20 degrees