Udp-Galactose 4-Epimerase
(All numbering and residues are taken from first PDB file)
![]()
![]()
Bending Residue Dihedral Analysis
Residue
iResidue
i+1Distance of hinge axis to residue i in
(A) Distance of hinge axis to residue i in
(A) Change in
(deg) Change in
(deg) Angle of psi(i) axis to hinge axis
(deg) Angle of psi(i) axis to hinge axis
(deg) Percentage Progress
MET-189
GLY-190
19.0
19.1
16.4
-6.3
114.1
114.8
-118.8
GLY-190
GLU-191
16.7
16.8
9.1
-14.6
111.0
108.6
-8.5
GLU-191
ASP-192
16.9
17.2
-7.1
59.6
138.4
139.6
383.7
ASP-192
PRO-193
19.4
19.4
86.7
9.3
110.0
101.4
-391.9
PRO-193
GLN-194
20.2
18.8
-24.5
6.4
134.7
50.3
-72.9
GLN-194
GLY-195
23.2
20.5
11.9
-136.0
97.1
81.9
-130.1
GLY-195
ILE-196
23.4
23.0
107.8
-60.9
102.7
118.5
-124.1
ILE-196
PRO-197
21.1
21.4
-35.3
21.5
40.1
64.6
73.9
PRO-197
ASN-198
18.3
17.7
9.1
-3.4
136.1
158.5
-5.0
ASN-198
ASN-199
18.0
16.3
12.9
-58.3
105.2
91.3
18.2
ASN-199
LEU-200
14.3
13.0
24.5
-12.5
48.1
28.1
88.8
LEU-200
MET-201
11.4
11.3
19.1
6.8
38.9
36.3
258.4
MET-201
PRO-202
9.7
9.3
8.5
4.4
37.9
34.0
-20.3
PRO-202
TYR-203
12.7
12.2
-1.6
-5.3
119.2
123.1
29.0
TYR-203
ILE-204
13.6
12.9
1.3
-5.5
50.8
61.2
-55.0
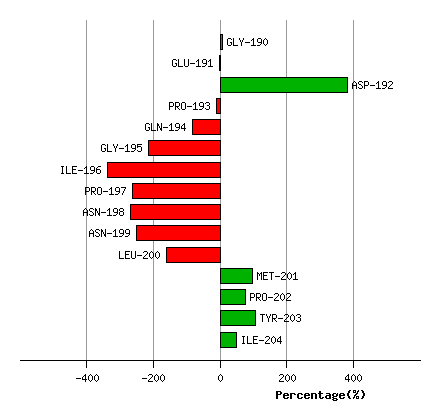
Graph shows rotational transition at bending residues and can be used
to identify hinge bending residues.
Probably only informative for interdomain rotations greater than 20 degrees
Residue
iResidue
i+1Distance of hinge axis to residue i in
(A) Distance of hinge axis to residue i in
(A) Change in
(deg) Change in
(deg) Angle of psi(i) axis to hinge axis
(deg) Angle of psi(i) axis to hinge axis
(deg) Percentage Progress
GLN-206
VAL-207
13.5
12.1
-12.3
10.4
60.3
54.9
104.5
VAL-207
ALA-208
12.6
11.4
9.3
-2.2
135.5
129.2
4.3
ALA-208
VAL-209
9.2
7.9
-3.5
-8.3
39.8
30.8
-28.6
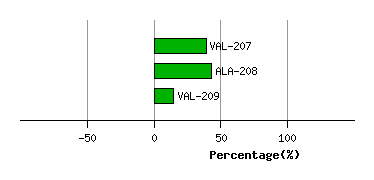
Graph shows rotational transition at bending residues and can be used
to identify hinge bending residues.
Probably only informative for interdomain rotations greater than 20 degrees
Residue
iResidue
i+1Distance of hinge axis to residue i in
(A) Distance of hinge axis to residue i in
(A) Change in
(deg) Change in
(deg) Angle of psi(i) axis to hinge axis
(deg) Angle of psi(i) axis to hinge axis
(deg) Percentage Progress
SER-214
LEU-215
15.8
15.2
12.0
-13.2
158.7
158.3
-30.6
LEU-215
ALA-216
14.5
14.3
13.2
-4.2
124.1
129.5
-21.8
ALA-216
ILE-217
16.9
16.6
11.4
-20.3
146.5
147.1
30.9
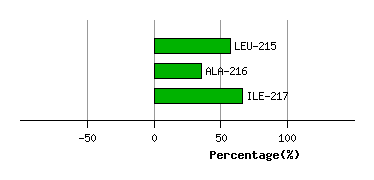
Graph shows rotational transition at bending residues and can be used
to identify hinge bending residues.
Probably only informative for interdomain rotations greater than 20 degrees
Residue
iResidue
i+1Distance of hinge axis to residue i in
(A) Distance of hinge axis to residue i in
(A) Change in
(deg) Change in
(deg) Angle of psi(i) axis to hinge axis
(deg) Angle of psi(i) axis to hinge axis
(deg) Percentage Progress
VAL-230
ARG-231
7.3
7.3
-12.7
17.5
111.9
108.5
15.2
ARG-231
ASP-232
5.8
6.5
-4.7
-2.8
85.3
88.6
8.8
ASP-232
TYR-233
4.2
5.2
14.5
-37.6
132.2
131.7
177.5
TYR-233
ILE-234
5.5
6.2
6.1
-1.5
85.5
85.0
-6.8
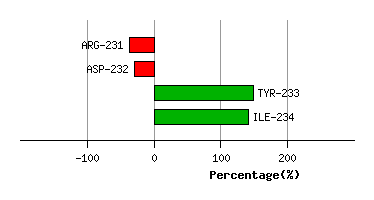
Graph shows rotational transition at bending residues and can be used
to identify hinge bending residues.
Probably only informative for interdomain rotations greater than 20 degrees
Residue
iResidue
i+1Distance of hinge axis to residue i in
(A) Distance of hinge axis to residue i in
(A) Change in
(deg) Change in
(deg) Angle of psi(i) axis to hinge axis
(deg) Angle of psi(i) axis to hinge axis
(deg) Percentage Progress
ASN-267
SER-268
3.2
3.0
-3.4
2.6
99.6
97.0
-24.6
SER-268
VAL-269
6.8
6.7
-12.1
-0.2
146.2
151.6
-88.4
VAL-269
LEU-270
8.5
8.4
4.0
0.7
37.2
38.7
36.4
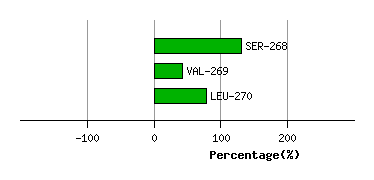
Graph shows rotational transition at bending residues and can be used
to identify hinge bending residues.
Probably only informative for interdomain rotations greater than 20 degrees
Residue
iResidue
i+1Distance of hinge axis to residue i in
(A) Distance of hinge axis to residue i in
(A) Change in
(deg) Change in
(deg) Angle of psi(i) axis to hinge axis
(deg) Angle of psi(i) axis to hinge axis
(deg) Percentage Progress
SER-277
LYS-278
3.5
3.2
-3.6
8.5
66.9
70.8
-11.7
LYS-278
ALA-279
2.1
2.9
0.8
-8.5
111.0
111.4
18.0
ALA-279
CYS-280
2.1
2.3
9.1
-2.0
152.5
149.3
-76.6
CYS-280
GLY-281
2.7
2.0
-24.0
3.7
141.1
145.5
-217.2
CYS-280
GLY-281
2.7
2.0
-24.0
3.7
141.1
145.5
-217.2
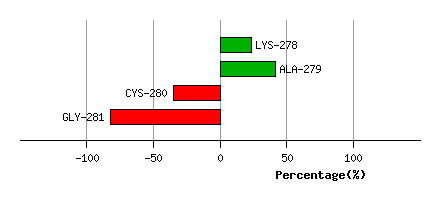
Graph shows rotational transition at bending residues and can be used
to identify hinge bending residues.
Probably only informative for interdomain rotations greater than 20 degrees
Residue
iResidue
i+1Distance of hinge axis to residue i in
(A) Distance of hinge axis to residue i in
(A) Change in
(deg) Change in
(deg) Angle of psi(i) axis to hinge axis
(deg) Angle of psi(i) axis to hinge axis
(deg) Percentage Progress
CYS-280
GLY-281
2.7
2.0
-24.0
3.7
141.1
145.5
-217.2
CYS-280
GLY-281
2.7
2.0
-24.0
3.7
141.1
145.5
-217.2
GLY-281
LYS-282
0.9
1.3
-21.6
64.2
109.1
108.9
26.6
LYS-282
PRO-283
4.6
4.1
11.9
-26.2
147.6
130.1
97.8
PRO-283
VAL-284
7.3
7.4
12.4
-51.0
101.2
121.5
108.6
VAL-284
ASN-285
8.4
9.1
-36.1
1.7
80.7
70.1
53.3
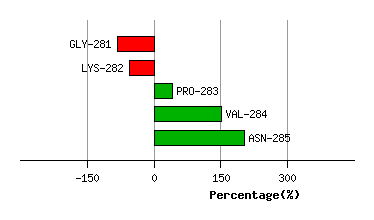
Graph shows rotational transition at bending residues and can be used
to identify hinge bending residues.
Probably only informative for interdomain rotations greater than 20 degrees
Residue
iResidue
i+1Distance of hinge axis to residue i in
(A) Distance of hinge axis to residue i in
(A) Change in
(deg) Change in
(deg) Angle of psi(i) axis to hinge axis
(deg) Angle of psi(i) axis to hinge axis
(deg) Percentage Progress
TRP-300
ALA-301
3.6
4.0
-12.7
-10.9
138.9
143.8
-207.6
ALA-301
ASP-302
4.5
4.3
0.2
3.0
66.7
82.2
132.4
ASP-302
ALA-303
4.4
4.3
10.2
-2.9
95.9
90.5
21.0
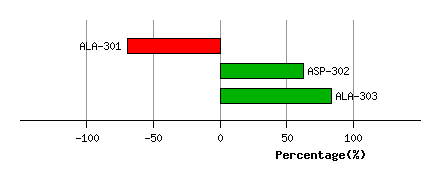
Graph shows rotational transition at bending residues and can be used
to identify hinge bending residues.
Probably only informative for interdomain rotations greater than 20 degrees