Bifunctional P-450/nadph-P450 Reductase
(All numbering and residues are taken from first PDB file)
![]()
![]()
Bending Residue Dihedral Analysis
Residue
iResidue
i+1Distance of hinge axis to residue i in
(A) Distance of hinge axis to residue i in
(A) Change in
(deg) Change in
(deg) Angle of psi(i) axis to hinge axis
(deg) Angle of psi(i) axis to hinge axis
(deg) Percentage Progress
PHE-173
ILE-174
12.2
12.7
3.6
2.7
83.0
77.4
20.1
ILE-174
THR-175
14.2
14.8
-0.3
3.6
69.2
63.3
-32.1
THR-175
SER-176
17.6
18.1
-11.1
1.3
5.1
14.6
103.7
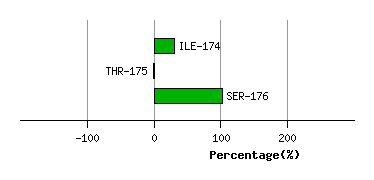
Graph shows rotational transition at bending residues and can be used
to identify hinge bending residues.
Probably only informative for interdomain rotations greater than 20 degrees
Residue
iResidue
i+1Distance of hinge axis to residue i in
(A) Distance of hinge axis to residue i in
(A) Change in
(deg) Change in
(deg) Angle of psi(i) axis to hinge axis
(deg) Angle of psi(i) axis to hinge axis
(deg) Percentage Progress
LYS-218
ILE-219
6.1
6.3
1.5
-5.1
122.5
118.8
104.4
ILE-219
ILE-220
3.0
3.0
-4.9
7.7
119.3
123.0
-16.5
ILE-220
ALA-221
3.5
3.3
2.7
0.3
86.2
88.8
-78.5
ALA-221
ASP-222
7.0
7.0
3.2
-3.9
148.2
147.9
7.3
ASP-222
ARG-223
7.9
7.5
-3.7
7.6
78.5
85.9
78.6
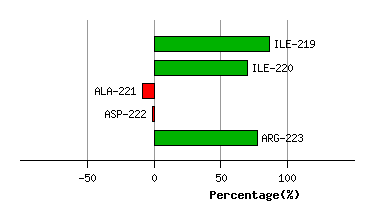
Graph shows rotational transition at bending residues and can be used
to identify hinge bending residues.
Probably only informative for interdomain rotations greater than 20 degrees
Residue
iResidue
i+1Distance of hinge axis to residue i in
(A) Distance of hinge axis to residue i in
(A) Change in
(deg) Change in
(deg) Angle of psi(i) axis to hinge axis
(deg) Angle of psi(i) axis to hinge axis
(deg) Percentage Progress
SER-230
ASP-231
11.1
10.8
-7.0
12.3
101.0
113.6
-121.8
ASP-231
ASP-232
11.5
11.9
-56.7
58.9
75.1
83.3
111.9
ASP-232
LEU-233
9.1
9.1
2.3
-5.3
34.1
35.1
32.6
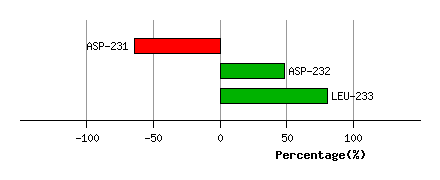
Graph shows rotational transition at bending residues and can be used
to identify hinge bending residues.
Probably only informative for interdomain rotations greater than 20 degrees
Residue
iResidue
i+1Distance of hinge axis to residue i in
(A) Distance of hinge axis to residue i in
(A) Change in
(deg) Change in
(deg) Angle of psi(i) axis to hinge axis
(deg) Angle of psi(i) axis to hinge axis
(deg) Percentage Progress
ILE-258
ILE-259
5.8
5.9
-3.0
1.6
104.8
104.5
17.0
ILE-259
THR-260
8.2
8.4
5.6
-5.3
63.4
64.9
17.6
THR-260
PHE-261
11.0
11.1
-8.4
11.7
164.8
167.2
67.9
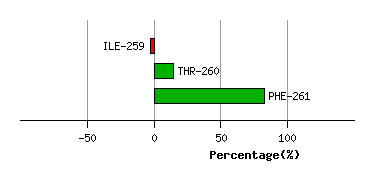
Graph shows rotational transition at bending residues and can be used
to identify hinge bending residues.
Probably only informative for interdomain rotations greater than 20 degrees
Residue
iResidue
i+1Distance of hinge axis to residue i in
(A) Distance of hinge axis to residue i in
(A) Change in
(deg) Change in
(deg) Angle of psi(i) axis to hinge axis
(deg) Angle of psi(i) axis to hinge axis
(deg) Percentage Progress
ILE-263
ALA-264
12.0
12.4
-8.6
2.0
62.6
56.6
84.1
ALA-264
GLY-265
13.8
14.0
-0.8
1.5
27.9
28.1
-54.3
GLY-265
HIS-266
11.5
11.5
-3.4
-5.5
38.9
40.6
126.7
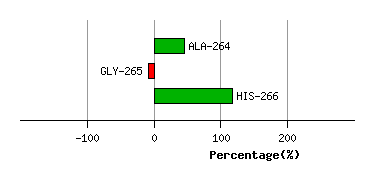
Graph shows rotational transition at bending residues and can be used
to identify hinge bending residues.
Probably only informative for interdomain rotations greater than 20 degrees