Alcohol Dehydrogenase Class III Chi Chain
(All numbering and residues are taken from first PDB file)
![]()
![]()
Bending Residue Dihedral Analysis
Residue
iResidue
i+1Distance of hinge axis to residue i in
(A) Distance of hinge axis to residue i in
(A) Change in
(deg) Change in
(deg) Angle of psi(i) axis to hinge axis
(deg) Angle of psi(i) axis to hinge axis
(deg) Percentage Progress
ASN-4
GLU-5
16.7
15.4
173.4
-31.7
50.8
87.9
1208.2
GLU-5
VAL-6
18.2
17.7
20.2
30.7
75.1
65.2
349.6
VAL-6
ILE-7
18.0
17.5
49.6
-46.5
3.2
9.9
43.9
ILE-7
LYS-8
16.5
16.4
2.2
8.4
69.4
61.2
235.6
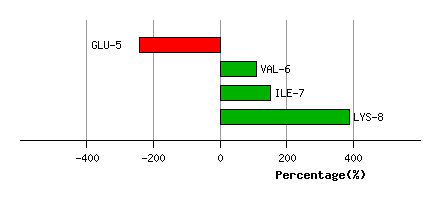
Graph shows rotational transition at bending residues and can be used
to identify hinge bending residues.
Probably only informative for interdomain rotations greater than 20 degrees
Residue
iResidue
i+1Distance of hinge axis to residue i in
(A) Distance of hinge axis to residue i in
(A) Change in
(deg) Change in
(deg) Angle of psi(i) axis to hinge axis
(deg) Angle of psi(i) axis to hinge axis
(deg) Percentage Progress
CYS-9
LYS-10
16.7
16.4
-0.1
-16.1
66.8
67.3
112.7
LYS-10
ALA-11
16.2
16.0
-1.3
8.1
115.9
110.6
39.9
ALA-11
ALA-12
15.5
15.4
-4.0
11.5
68.3
68.0
1.6
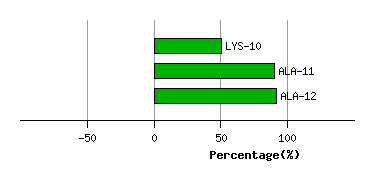
Graph shows rotational transition at bending residues and can be used
to identify hinge bending residues.
Probably only informative for interdomain rotations greater than 20 degrees
Residue
iResidue
i+1Distance of hinge axis to residue i in
(A) Distance of hinge axis to residue i in
(A) Change in
(deg) Change in
(deg) Angle of psi(i) axis to hinge axis
(deg) Angle of psi(i) axis to hinge axis
(deg) Percentage Progress
ILE-23
GLU-24
19.5
19.5
-31.3
29.5
56.5
59.5
79.6
GLU-24
GLU-25
20.6
20.7
-9.5
3.1
69.6
73.4
62.2
GLU-25
ILE-26
20.3
20.5
-31.0
34.9
13.4
7.0
-198.8
ILE-26
GLU-27
19.2
19.4
24.6
-19.3
120.6
119.9
149.1
GLU-27
VAL-28
18.7
18.5
42.7
-40.4
125.4
119.4
-21.0
VAL-28
ALA-29
15.1
15.1
15.7
-12.5
135.8
139.5
-48.5
VAL-28
ALA-29
15.1
15.1
15.7
-12.5
135.8
139.5
-48.5
Graph shows rotational transition at bending residues and can be used
to identify hinge bending residues.
Probably only informative for interdomain rotations greater than 20 degrees
Residue
iResidue
i+1Distance of hinge axis to residue i in
(A) Distance of hinge axis to residue i in
(A) Change in
(deg) Change in
(deg) Angle of psi(i) axis to hinge axis
(deg) Angle of psi(i) axis to hinge axis
(deg) Percentage Progress
VAL-28
ALA-29
15.1
15.1
15.7
-12.5
135.8
139.5
-48.5
VAL-28
ALA-29
15.1
15.1
15.7
-12.5
135.8
139.5
-48.5
ALA-29
PRO-30
15.2
15.0
-0.4
6.8
84.5
87.2
96.1
PRO-30
PRO-31
13.2
12.9
13.9
-22.6
134.8
126.7
236.0
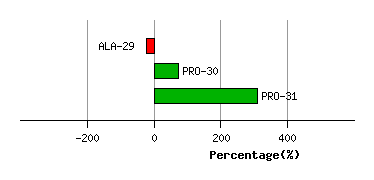
Graph shows rotational transition at bending residues and can be used
to identify hinge bending residues.
Probably only informative for interdomain rotations greater than 20 degrees
Residue
iResidue
i+1Distance of hinge axis to residue i in
(A) Distance of hinge axis to residue i in
(A) Change in
(deg) Change in
(deg) Angle of psi(i) axis to hinge axis
(deg) Angle of psi(i) axis to hinge axis
(deg) Percentage Progress
ARG-37
ILE-38
7.1
6.9
-8.7
3.4
36.1
34.3
110.6
ILE-38
LYS-39
5.3
5.1
5.3
-2.4
147.3
146.3
-53.0
LYS-39
ILE-40
6.7
6.5
4.6
-9.1
127.1
124.3
-37.9
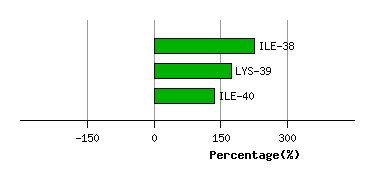
Graph shows rotational transition at bending residues and can be used
to identify hinge bending residues.
Probably only informative for interdomain rotations greater than 20 degrees
Residue
iResidue
i+1Distance of hinge axis to residue i in
(A) Distance of hinge axis to residue i in
(A) Change in
(deg) Change in
(deg) Angle of psi(i) axis to hinge axis
(deg) Angle of psi(i) axis to hinge axis
(deg) Percentage Progress
CYS-46
HIS-47
16.6
16.3
-3.6
-4.7
81.9
87.9
212.7
HIS-47
THR-48
20.3
20.1
7.1
-9.1
154.1
151.4
-11.7
THR-48
ASP-49
19.5
19.9
25.0
-12.5
89.7
92.8
-53.3
ASP-49
ALA-50
18.4
18.4
-1.6
-14.0
111.0
110.4
-217.3
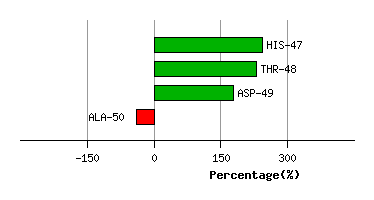
Graph shows rotational transition at bending residues and can be used
to identify hinge bending residues.
Probably only informative for interdomain rotations greater than 20 degrees
Residue
iResidue
i+1Distance of hinge axis to residue i in
(A) Distance of hinge axis to residue i in
(A) Change in
(deg) Change in
(deg) Angle of psi(i) axis to hinge axis
(deg) Angle of psi(i) axis to hinge axis
(deg) Percentage Progress
CYS-60A
PHE-61
23.6
23.6
9.6
-7.5
42.1
45.0
98.2
PHE-61
PRO-62
23.7
24.1
-9.1
2.4
65.7
64.7
185.5
PRO-62
VAL-63
22.9
23.1
12.6
-10.7
98.6
102.4
19.0
VAL-63
ILE-64
19.3
19.5
15.5
-20.4
37.6
35.5
-47.0
ILE-64
LEU-65
16.2
16.4
17.4
-14.0
88.7
89.7
-98.1
LEU-65
GLY-66
15.6
15.6
-2.3
8.2
110.6
110.4
36.9
GLY-66
HIS-67
12.8
12.7
-18.9
8.1
48.6
48.2
160.7
HIS-67
GLU-68
10.9
11.3
22.0
-22.8
61.9
61.8
-76.6
GLU-68
GLY-69
9.4
9.8
6.6
-20.0
70.9
68.0
-131.7
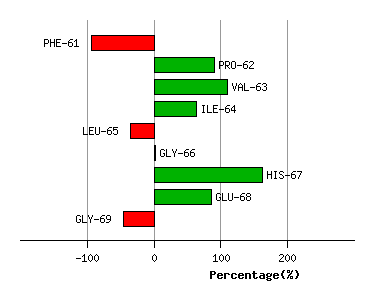
Graph shows rotational transition at bending residues and can be used
to identify hinge bending residues.
Probably only informative for interdomain rotations greater than 20 degrees
Residue
iResidue
i+1Distance of hinge axis to residue i in
(A) Distance of hinge axis to residue i in
(A) Change in
(deg) Change in
(deg) Angle of psi(i) axis to hinge axis
(deg) Angle of psi(i) axis to hinge axis
(deg) Percentage Progress
ALA-70
GLY-71
2.3
2.5
5.4
1.4
84.7
83.1
128.7
GLY-71
ILE-72
1.6
1.6
15.6
-13.6
121.8
121.4
-0.7
ILE-72
VAL-73
4.8
4.5
-1.1
5.4
33.0
31.4
-73.7
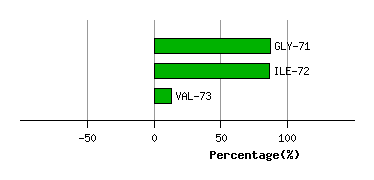
Graph shows rotational transition at bending residues and can be used
to identify hinge bending residues.
Probably only informative for interdomain rotations greater than 20 degrees
Residue
iResidue
i+1Distance of hinge axis to residue i in
(A) Distance of hinge axis to residue i in
(A) Change in
(deg) Change in
(deg) Angle of psi(i) axis to hinge axis
(deg) Angle of psi(i) axis to hinge axis
(deg) Percentage Progress
PRO-91
LEU-92
4.7
5.0
-26.9
28.7
92.6
99.3
118.7
LEU-92
TYR-93
8.1
8.1
-23.7
10.9
122.8
118.3
-103.3
TYR-93
ILE-94
11.2
11.1
-6.3
6.3
143.4
141.2
-65.7
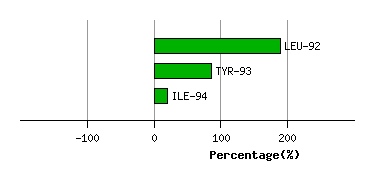
Graph shows rotational transition at bending residues and can be used
to identify hinge bending residues.
Probably only informative for interdomain rotations greater than 20 degrees
Residue
iResidue
i+1Distance of hinge axis to residue i in
(A) Distance of hinge axis to residue i in
(A) Change in
(deg) Change in
(deg) Angle of psi(i) axis to hinge axis
(deg) Angle of psi(i) axis to hinge axis
(deg) Percentage Progress
GLN-96
CYS-97
9.9
9.9
5.6
-4.7
137.2
134.6
18.2
CYS-97
GLY-98
8.0
8.0
1.1
9.3
112.8
108.3
-50.2
GLY-98
GLU-99
10.5
10.6
-20.3
15.5
10.5
17.9
92.2
GLU-99
CYS-100
10.8
11.0
-11.8
14.4
65.8
65.7
-68.9
CYS-100
LYS-101
12.3
12.3
-5.9
7.1
84.7
88.7
-7.9
CYS-100
LYS-101
12.3
12.3
-5.9
7.1
84.7
88.7
-7.9
Graph shows rotational transition at bending residues and can be used
to identify hinge bending residues.
Probably only informative for interdomain rotations greater than 20 degrees
Residue
iResidue
i+1Distance of hinge axis to residue i in
(A) Distance of hinge axis to residue i in
(A) Change in
(deg) Change in
(deg) Angle of psi(i) axis to hinge axis
(deg) Angle of psi(i) axis to hinge axis
(deg) Percentage Progress
CYS-100
LYS-101
12.3
12.3
-5.9
7.1
84.7
88.7
-7.9
CYS-100
LYS-101
12.3
12.3
-5.9
7.1
84.7
88.7
-7.9
LYS-101
PHE-102
16.0
16.1
-5.6
14.3
149.0
152.4
223.6
PHE-102
CYS-103
16.9
16.9
-16.6
13.8
119.9
119.0
-11.1
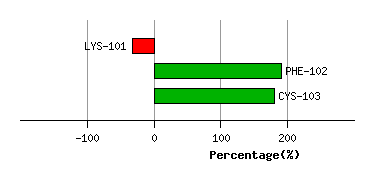
Graph shows rotational transition at bending residues and can be used
to identify hinge bending residues.
Probably only informative for interdomain rotations greater than 20 degrees
Residue
iResidue
i+1Distance of hinge axis to residue i in
(A) Distance of hinge axis to residue i in
(A) Change in
(deg) Change in
(deg) Angle of psi(i) axis to hinge axis
(deg) Angle of psi(i) axis to hinge axis
(deg) Percentage Progress
LEU-110
CYS-111
16.8
16.7
-3.9
4.8
138.5
143.0
49.4
CYS-111
GLN-112
13.5
13.6
13.2
-13.7
74.1
76.9
-54.9
GLN-112
LYS-113
14.1
14.1
8.9
9.0
68.5
67.5
80.6
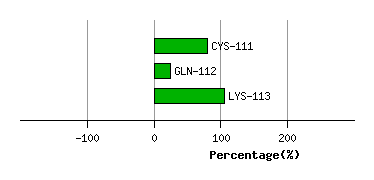
Graph shows rotational transition at bending residues and can be used
to identify hinge bending residues.
Probably only informative for interdomain rotations greater than 20 degrees
Residue
iResidue
i+1Distance of hinge axis to residue i in
(A) Distance of hinge axis to residue i in
(A) Change in
(deg) Change in
(deg) Angle of psi(i) axis to hinge axis
(deg) Angle of psi(i) axis to hinge axis
(deg) Percentage Progress
GLN-118
GLY-119
13.8
14.2
0.8
-2.1
71.3
66.7
74.6
GLY-119
LYS-120
17.5
17.8
10.4
-7.0
87.9
85.5
111.7
LYS-120
GLY-121
18.6
18.8
-14.7
9.9
129.1
128.2
-111.4
GLY-121
LEU-122
16.7
16.6
19.9
-17.2
110.7
117.3
34.1
LEU-122
MET-123
14.8
14.6
-11.9
7.7
81.1
76.6
29.2
MET-123
PRO-124
11.3
11.1
1.6
-1.5
157.5
158.4
13.4
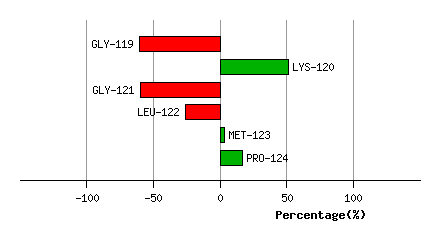
Graph shows rotational transition at bending residues and can be used
to identify hinge bending residues.
Probably only informative for interdomain rotations greater than 20 degrees
Residue
iResidue
i+1Distance of hinge axis to residue i in
(A) Distance of hinge axis to residue i in
(A) Change in
(deg) Change in
(deg) Angle of psi(i) axis to hinge axis
(deg) Angle of psi(i) axis to hinge axis
(deg) Percentage Progress
ASP-125
GLY-126
11.5
11.3
-12.7
13.9
85.0
87.4
-88.4
GLY-126
THR-127
14.9
14.6
-17.7
11.7
58.5
52.3
141.7
THR-127
SER-128
15.7
15.6
3.0
3.3
158.8
159.6
-176.4
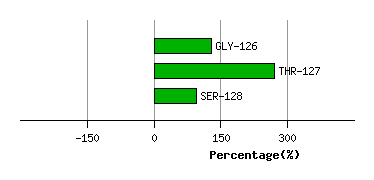
Graph shows rotational transition at bending residues and can be used
to identify hinge bending residues.
Probably only informative for interdomain rotations greater than 20 degrees
Residue
iResidue
i+1Distance of hinge axis to residue i in
(A) Distance of hinge axis to residue i in
(A) Change in
(deg) Change in
(deg) Angle of psi(i) axis to hinge axis
(deg) Angle of psi(i) axis to hinge axis
(deg) Percentage Progress
THR-136
ILE-137
22.0
22.1
5.8
-7.0
54.9
56.6
30.8
ILE-137
LEU-138
20.0
20.0
1.4
-0.1
122.8
115.7
131.1
LEU-138
HIS-139
18.2
18.1
8.7
-8.1
58.9
59.6
-3.7
HIS-139
TYR-140
14.7
14.7
7.0
-18.2
100.6
103.7
0.4
HIS-139
TYR-140
14.7
14.7
7.0
-18.2
100.6
103.7
0.4
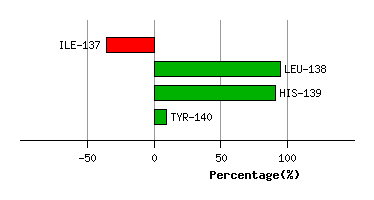
Graph shows rotational transition at bending residues and can be used
to identify hinge bending residues.
Probably only informative for interdomain rotations greater than 20 degrees
Residue
iResidue
i+1Distance of hinge axis to residue i in
(A) Distance of hinge axis to residue i in
(A) Change in
(deg) Change in
(deg) Angle of psi(i) axis to hinge axis
(deg) Angle of psi(i) axis to hinge axis
(deg) Percentage Progress
HIS-139
TYR-140
14.7
14.7
7.0
-18.2
100.6
103.7
0.4
HIS-139
TYR-140
14.7
14.7
7.0
-18.2
100.6
103.7
0.4
TYR-140
MET-141
14.8
15.0
-21.9
24.6
100.2
93.2
98.4
MET-141
GLY-142
13.5
13.9
-10.1
3.3
106.3
106.5
32.4
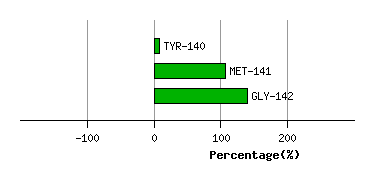
Graph shows rotational transition at bending residues and can be used
to identify hinge bending residues.
Probably only informative for interdomain rotations greater than 20 degrees
Residue
iResidue
i+1Distance of hinge axis to residue i in
(A) Distance of hinge axis to residue i in
(A) Change in
(deg) Change in
(deg) Angle of psi(i) axis to hinge axis
(deg) Angle of psi(i) axis to hinge axis
(deg) Percentage Progress
SER-144
THR-145
11.2
11.5
11.4
-13.8
41.7
46.1
-139.7
THR-145
PHE-146
9.1
9.3
23.2
-18.5
43.9
39.3
131.7
PHE-146
SER-147
12.0
12.0
10.3
-7.2
101.1
99.4
77.6
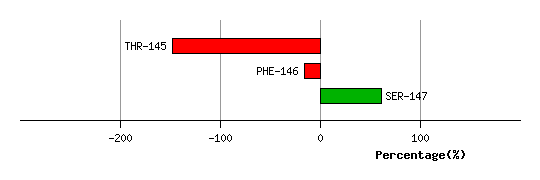
Graph shows rotational transition at bending residues and can be used
to identify hinge bending residues.
Probably only informative for interdomain rotations greater than 20 degrees
Residue
iResidue
i+1Distance of hinge axis to residue i in
(A) Distance of hinge axis to residue i in
(A) Change in
(deg) Change in
(deg) Angle of psi(i) axis to hinge axis
(deg) Angle of psi(i) axis to hinge axis
(deg) Percentage Progress
VAL-152
ALA-153
5.8
6.1
9.5
7.6
32.8
29.6
357.0
ALA-153
ASP-154
4.4
4.9
-0.6
-34.6
84.3
76.4
-67.7
ASP-154
ILE-155
0.7
1.1
35.7
-10.9
105.7
90.2
-104.9
ILE-155
SER-156
4.1
4.3
12.6
-18.8
34.6
39.0
12.7
ILE-155
SER-156
4.1
4.3
12.6
-18.8
34.6
39.0
12.7
Graph shows rotational transition at bending residues and can be used
to identify hinge bending residues.
Probably only informative for interdomain rotations greater than 20 degrees
Residue
iResidue
i+1Distance of hinge axis to residue i in
(A) Distance of hinge axis to residue i in
(A) Change in
(deg) Change in
(deg) Angle of psi(i) axis to hinge axis
(deg) Angle of psi(i) axis to hinge axis
(deg) Percentage Progress
ILE-155
SER-156
4.1
4.3
12.6
-18.8
34.6
39.0
12.7
ILE-155
SER-156
4.1
4.3
12.6
-18.8
34.6
39.0
12.7
SER-156
VAL-157
5.2
5.4
31.9
-32.7
35.5
39.2
-37.4
VAL-157
ALA-158
3.2
3.4
-9.6
12.0
95.3
99.6
92.2
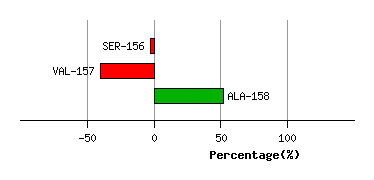
Graph shows rotational transition at bending residues and can be used
to identify hinge bending residues.
Probably only informative for interdomain rotations greater than 20 degrees
Residue
iResidue
i+1Distance of hinge axis to residue i in
(A) Distance of hinge axis to residue i in
(A) Change in
(deg) Change in
(deg) Angle of psi(i) axis to hinge axis
(deg) Angle of psi(i) axis to hinge axis
(deg) Percentage Progress
LEU-163
ALA-164
10.3
10.6
-42.0
26.8
74.7
69.0
237.7
ALA-164
PRO-165
8.2
8.5
7.2
-16.4
122.3
118.7
222.6
PRO-165
LEU-166
5.8
5.8
16.8
-10.7
58.3
60.5
132.4
LEU-166
ASP-167
2.8
2.9
1.4
9.0
66.0
62.1
100.4
LEU-166
ASP-167
2.8
2.9
1.4
9.0
66.0
62.1
100.4

Graph shows rotational transition at bending residues and can be used
to identify hinge bending residues.
Probably only informative for interdomain rotations greater than 20 degrees
Residue
iResidue
i+1Distance of hinge axis to residue i in
(A) Distance of hinge axis to residue i in
(A) Change in
(deg) Change in
(deg) Angle of psi(i) axis to hinge axis
(deg) Angle of psi(i) axis to hinge axis
(deg) Percentage Progress
LEU-166
ASP-167
2.8
2.9
1.4
9.0
66.0
62.1
100.4
LEU-166
ASP-167
2.8
2.9
1.4
9.0
66.0
62.1
100.4
ASP-167
LYS-168
2.9
3.2
-13.3
21.3
97.4
97.2
-67.0
LYS-168
VAL-169
6.5
6.7
-15.4
-1.1
26.9
25.1
361.5
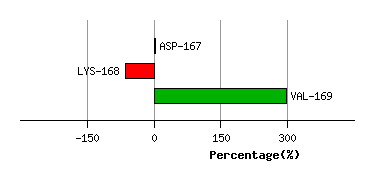
Graph shows rotational transition at bending residues and can be used
to identify hinge bending residues.
Probably only informative for interdomain rotations greater than 20 degrees
Residue
iResidue
i+1Distance of hinge axis to residue i in
(A) Distance of hinge axis to residue i in
(A) Change in
(deg) Change in
(deg) Angle of psi(i) axis to hinge axis
(deg) Angle of psi(i) axis to hinge axis
(deg) Percentage Progress
PHE-345
VAL-346
14.3
14.3
1.7
1.3
105.5
109.1
-132.1
VAL-346
THR-347
11.4
11.4
8.4
-13.0
158.8
156.1
75.8
THR-347
HIS-348
13.1
13.1
-5.8
7.1
69.3
68.3
-27.2
HIS-348
ASN-349
11.3
11.3
22.0
-27.4
58.9
58.5
-61.0
ASN-349
LEU-350
8.5
8.6
-4.2
-7.4
80.0
80.3
65.8
LEU-350
SER-351
10.0
10.0
-8.7
17.4
114.9
124.3
49.3
LEU-350
SER-351
10.0
10.0
-8.7
17.4
114.9
124.3
49.3
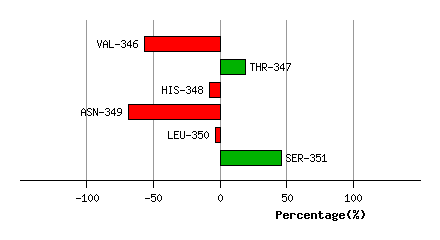
Graph shows rotational transition at bending residues and can be used
to identify hinge bending residues.
Probably only informative for interdomain rotations greater than 20 degrees
Residue
iResidue
i+1Distance of hinge axis to residue i in
(A) Distance of hinge axis to residue i in
(A) Change in
(deg) Change in
(deg) Angle of psi(i) axis to hinge axis
(deg) Angle of psi(i) axis to hinge axis
(deg) Percentage Progress
LEU-350
SER-351
10.0
10.0
-8.7
17.4
114.9
124.3
49.3
LEU-350
SER-351
10.0
10.0
-8.7
17.4
114.9
124.3
49.3
SER-351
PHE-352
10.4
10.2
13.9
-9.4
39.9
38.8
65.4
PHE-352
ASP-353
12.1
12.0
5.2
-11.1
104.0
102.3
0.9
Graph shows rotational transition at bending residues and can be used
to identify hinge bending residues.
Probably only informative for interdomain rotations greater than 20 degrees
Residue
iResidue
i+1Distance of hinge axis to residue i in
(A) Distance of hinge axis to residue i in
(A) Change in
(deg) Change in
(deg) Angle of psi(i) axis to hinge axis
(deg) Angle of psi(i) axis to hinge axis
(deg) Percentage Progress
ILE-355
ASN-356
15.2
15.0
19.2
-11.7
84.2
88.2
-109.4
ASN-356
LYS-357
18.7
18.6
-2.2
0.4
136.1
135.9
-77.2
LYS-357
ALA-358
17.9
17.8
1.6
0.2
109.2
110.0
-56.2
ALA-358
PHE-359
16.2
16.0
6.9
-6.6
113.9
114.3
49.1
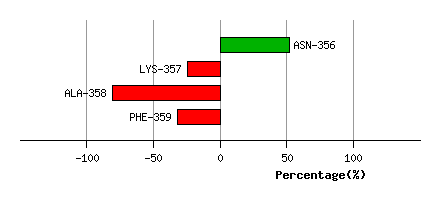
Graph shows rotational transition at bending residues and can be used
to identify hinge bending residues.
Probably only informative for interdomain rotations greater than 20 degrees
Residue
iResidue
i+1Distance of hinge axis to residue i in
(A) Distance of hinge axis to residue i in
(A) Change in
(deg) Change in
(deg) Angle of psi(i) axis to hinge axis
(deg) Angle of psi(i) axis to hinge axis
(deg) Percentage Progress
GLU-360
LEU-361
21.1
21.4
-1.1
13.7
117.3
112.8
0.0
LEU-361
MET-362
19.6
19.5
-16.9
-0.9
53.0
54.2
278.9
MET-362
HIS-363
20.5
20.5
3.4
-6.1
84.3
88.7
-170.1
HIS-363
SER-364
24.1
24.0
-33.3
47.6
148.2
152.9
258.8
SER-364
GLY-365
24.2
24.0
-15.2
10.3
96.3
94.6
-78.9
GLY-365
LYS-366
23.4
23.3
-32.3
31.2
137.4
134.2
-30.6
LYS-366
SER-367
20.4
20.6
15.9
-34.6
117.7
109.0
336.1
SER-367
ILE-368
17.8
17.9
14.5
12.5
128.8
142.2
-506.4
ILE-368
ARG-369
17.4
17.5
-34.5
37.2
134.1
128.2
-81.5
ILE-368
ARG-369
17.4
17.5
-34.5
37.2
134.1
128.2
-81.5
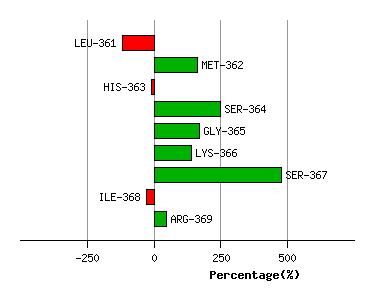
Graph shows rotational transition at bending residues and can be used
to identify hinge bending residues.
Probably only informative for interdomain rotations greater than 20 degrees
Residue
iResidue
i+1Distance of hinge axis to residue i in
(A) Distance of hinge axis to residue i in
(A) Change in
(deg) Change in
(deg) Angle of psi(i) axis to hinge axis
(deg) Angle of psi(i) axis to hinge axis
(deg) Percentage Progress
ILE-368
ARG-369
17.4
17.5
-34.5
37.2
134.1
128.2
-81.5
ILE-368
ARG-369
17.4
17.5
-34.5
37.2
134.1
128.2
-81.5
ARG-369
THR-370
14.1
14.1
31.4
-33.0
122.8
126.1
25.2
THR-370
VAL-371
12.5
11.9
-7.5
13.5
124.5
125.1
91.0
VAL-371
VAL-372
8.9
8.4
-16.9
26.0
72.9
75.5
-32.6
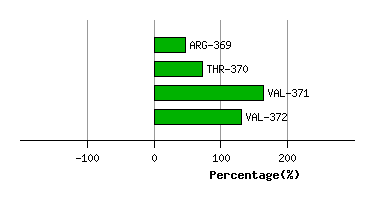
Graph shows rotational transition at bending residues and can be used
to identify hinge bending residues.
Probably only informative for interdomain rotations greater than 20 degrees