Creatine Kinase, M Chain
(All numbering and residues are taken from first PDB file)
![]()
![]()
Bending Residue Dihedral Analysis
Residue
iResidue
i+1Distance of hinge axis to residue i in
(A) Distance of hinge axis to residue i in
(A) Change in
(deg) Change in
(deg) Angle of psi(i) axis to hinge axis
(deg) Angle of psi(i) axis to hinge axis
(deg) Percentage Progress
LYS-105
HIS-106
3.7
3.5
9.6
-19.8
120.2
118.8
39.4
HIS-106
LYS-107
1.4
1.2
-21.8
32.9
81.2
73.9
-8.0
LYS-107
THR-108
3.7
3.9
1.5
-12.6
139.3
149.6
76.9
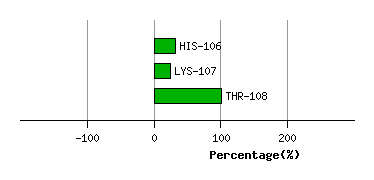
Graph shows rotational transition at bending residues and can be used
to identify hinge bending residues.
Probably only informative for interdomain rotations greater than 20 degrees
Residue
iResidue
i+1Distance of hinge axis to residue i in
(A) Distance of hinge axis to residue i in
(A) Change in
(deg) Change in
(deg) Angle of psi(i) axis to hinge axis
(deg) Angle of psi(i) axis to hinge axis
(deg) Percentage Progress
ARG-132
THR-133
9.0
9.3
-7.1
1.6
50.9
51.5
46.9
THR-133
GLY-134
5.6
5.9
-0.1
-1.1
129.0
127.7
-7.7
GLY-134
ARG-135
3.6
4.0
-10.0
8.7
75.4
75.0
41.3
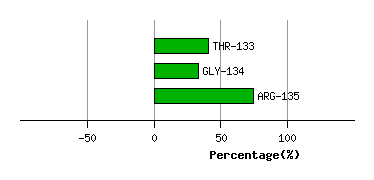
Graph shows rotational transition at bending residues and can be used
to identify hinge bending residues.
Probably only informative for interdomain rotations greater than 20 degrees
Residue
iResidue
i+1Distance of hinge axis to residue i in
(A) Distance of hinge axis to residue i in
(A) Change in
(deg) Change in
(deg) Angle of psi(i) axis to hinge axis
(deg) Angle of psi(i) axis to hinge axis
(deg) Percentage Progress
ASP-160
GLY-161
7.5
7.6
22.3
-11.8
39.6
47.5
22.7
GLY-161
LEU-162
7.7
8.0
-8.4
19.9
91.5
78.4
-44.7
LEU-162
ALA-163
6.5
6.6
-22.9
4.1
39.9
36.5
120.6
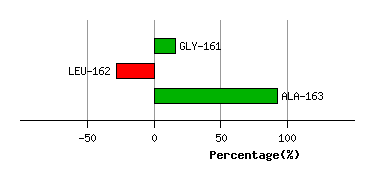
Graph shows rotational transition at bending residues and can be used
to identify hinge bending residues.
Probably only informative for interdomain rotations greater than 20 degrees
Residue
iResidue
i+1Distance of hinge axis to residue i in
(A) Distance of hinge axis to residue i in
(A) Change in
(deg) Change in
(deg) Angle of psi(i) axis to hinge axis
(deg) Angle of psi(i) axis to hinge axis
(deg) Percentage Progress
GLU-168
PHE-169
16.8
16.8
-4.6
8.9
90.5
96.6
32.6
PHE-169
GLN-170
13.1
13.1
1.7
-8.5
29.8
25.7
-75.0
GLN-170
GLY-171
12.8
12.8
7.4
-4.5
76.4
77.9
36.0
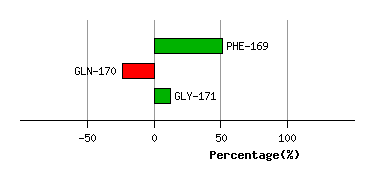
Graph shows rotational transition at bending residues and can be used
to identify hinge bending residues.
Probably only informative for interdomain rotations greater than 20 degrees
Residue
iResidue
i+1Distance of hinge axis to residue i in
(A) Distance of hinge axis to residue i in
(A) Change in
(deg) Change in
(deg) Angle of psi(i) axis to hinge axis
(deg) Angle of psi(i) axis to hinge axis
(deg) Percentage Progress
PRO-175
LEU-176
5.5
5.0
1.4
-20.6
103.5
99.6
30.8
LEU-176
SER-177
9.3
8.8
-4.5
18.5
20.5
32.7
-58.1
SER-177
SER-178
9.4
9.5
-29.0
-18.8
43.8
23.4
297.2
SER-178
MET-179
7.5
7.7
44.1
17.6
88.7
87.7
68.3
MET-179
SER-180
10.7
9.0
-6.2
-4.7
67.4
43.9
33.2
SER-180
ASP-181
14.0
10.8
-5.3
0.7
139.9
116.9
-41.1
ASP-181
ALA-182
17.0
14.5
1.9
-2.4
73.4
72.6
15.6
ALA-182
GLU-183
18.4
14.5
3.9
-6.1
58.3
33.6
7.8
GLU-183
GLN-184
15.5
11.8
6.4
-19.6
20.4
36.0
-121.8
GLN-184
GLN-185
14.9
13.5
14.3
-3.5
54.1
73.3
81.9
GLN-185
GLN-186
18.5
17.1
-10.9
10.6
101.6
121.7
43.1
GLN-186
LEU-187
18.7
16.1
-7.1
-2.7
143.4
163.5
-115.4
LEU-187
ILE-188
15.8
14.2
4.4
6.2
31.5
58.7
91.1
ILE-188
ASP-189
17.4
17.2
4.3
-37.8
71.8
70.6
-127.8
ASP-189
ASP-190
20.8
19.6
57.2
-32.0
62.5
65.3
164.7
ASP-190
HIS-191
19.5
17.2
-25.8
10.9
146.4
156.5
-119.0
HIS-191
PHE-192
17.5
16.6
-5.2
5.6
90.9
75.3
-18.3
HIS-191
PHE-192
17.5
16.6
-5.2
5.6
90.9
75.3
-18.3
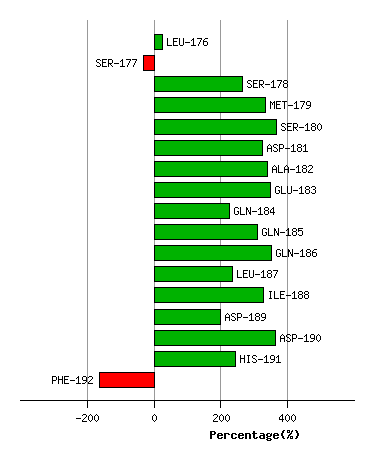
Graph shows rotational transition at bending residues and can be used
to identify hinge bending residues.
Probably only informative for interdomain rotations greater than 20 degrees
Residue
iResidue
i+1Distance of hinge axis to residue i in
(A) Distance of hinge axis to residue i in
(A) Change in
(deg) Change in
(deg) Angle of psi(i) axis to hinge axis
(deg) Angle of psi(i) axis to hinge axis
(deg) Percentage Progress
HIS-191
PHE-192
17.5
16.6
-5.2
5.6
90.9
75.3
-18.3
HIS-191
PHE-192
17.5
16.6
-5.2
5.6
90.9
75.3
-18.3
PHE-192
LEU-193
14.2
12.8
34.6
12.7
87.3
76.8
144.4
LEU-193
PHE-194
12.6
13.0
-0.2
-74.8
59.4
50.3
340.3
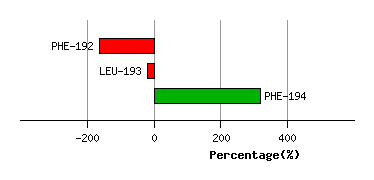
Graph shows rotational transition at bending residues and can be used
to identify hinge bending residues.
Probably only informative for interdomain rotations greater than 20 degrees
Residue
iResidue
i+1Distance of hinge axis to residue i in
(A) Distance of hinge axis to residue i in
(A) Change in
(deg) Change in
(deg) Angle of psi(i) axis to hinge axis
(deg) Angle of psi(i) axis to hinge axis
(deg) Percentage Progress
ILE-217
TRP-218
6.2
5.9
-11.6
-5.7
69.4
75.4
58.7
TRP-218
HIS-219
5.4
5.4
-1.7
15.2
117.7
118.2
80.7
HIS-219
ASN-220
9.0
8.9
-12.6
5.8
58.5
69.0
57.1
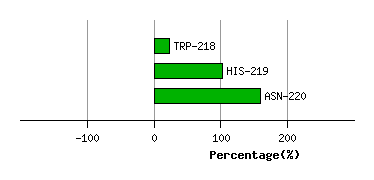
Graph shows rotational transition at bending residues and can be used
to identify hinge bending residues.
Probably only informative for interdomain rotations greater than 20 degrees
Residue
iResidue
i+1Distance of hinge axis to residue i in
(A) Distance of hinge axis to residue i in
(A) Change in
(deg) Change in
(deg) Angle of psi(i) axis to hinge axis
(deg) Angle of psi(i) axis to hinge axis
(deg) Percentage Progress
THR-224
PHE-225
15.1
15.2
11.5
-6.8
122.4
118.8
-16.2
PHE-225
LEU-226
11.6
11.4
12.7
-1.0
53.9
56.0
46.6
LEU-226
VAL-227
8.7
8.8
-24.7
5.4
62.6
66.5
59.5
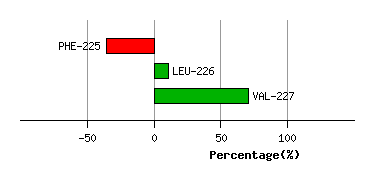
Graph shows rotational transition at bending residues and can be used
to identify hinge bending residues.
Probably only informative for interdomain rotations greater than 20 degrees
Residue
iResidue
i+1Distance of hinge axis to residue i in
(A) Distance of hinge axis to residue i in
(A) Change in
(deg) Change in
(deg) Angle of psi(i) axis to hinge axis
(deg) Angle of psi(i) axis to hinge axis
(deg) Percentage Progress
ARG-236
VAL-237
4.9
4.9
6.6
-21.2
107.6
108.9
29.2
VAL-237
ILE-238
5.4
5.6
15.8
-16.9
72.0
66.4
48.7
ILE-238
SER-239
9.1
9.4
-12.7
20.1
80.4
74.8
-18.1
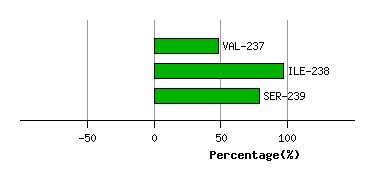
Graph shows rotational transition at bending residues and can be used
to identify hinge bending residues.
Probably only informative for interdomain rotations greater than 20 degrees
Residue
iResidue
i+1Distance of hinge axis to residue i in
(A) Distance of hinge axis to residue i in
(A) Change in
(deg) Change in
(deg) Angle of psi(i) axis to hinge axis
(deg) Angle of psi(i) axis to hinge axis
(deg) Percentage Progress
CYS-254
VAL-255
11.2
11.1
2.0
-5.7
52.4
56.6
-5.7
VAL-255
GLY-256
13.2
13.0
11.2
-5.2
42.8
40.9
23.9
GLY-256
LEU-257
10.7
10.5
8.8
-8.0
110.1
105.6
-1.3
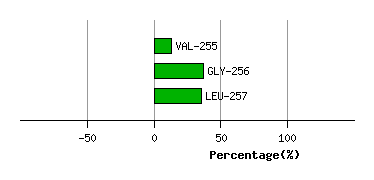
Graph shows rotational transition at bending residues and can be used
to identify hinge bending residues.
Probably only informative for interdomain rotations greater than 20 degrees
Residue
iResidue
i+1Distance of hinge axis to residue i in
(A) Distance of hinge axis to residue i in
(A) Change in
(deg) Change in
(deg) Angle of psi(i) axis to hinge axis
(deg) Angle of psi(i) axis to hinge axis
(deg) Percentage Progress
LYS-259
ILE-260
11.1
11.2
18.9
-26.5
109.3
115.3
-14.6
ILE-260
GLU-261
7.7
7.9
13.6
-0.5
58.1
53.0
59.3
GLU-261
ASP-262
7.8
8.4
-7.8
-0.1
83.7
86.0
-12.5
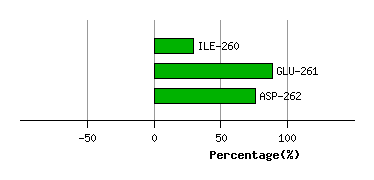
Graph shows rotational transition at bending residues and can be used
to identify hinge bending residues.
Probably only informative for interdomain rotations greater than 20 degrees
Residue
iResidue
i+1Distance of hinge axis to residue i in
(A) Distance of hinge axis to residue i in
(A) Change in
(deg) Change in
(deg) Angle of psi(i) axis to hinge axis
(deg) Angle of psi(i) axis to hinge axis
(deg) Percentage Progress
PHE-271
MET-272
6.9
6.0
-12.5
-6.1
33.3
39.2
189.1
MET-272
TRP-273
7.8
7.2
13.2
-13.9
145.1
145.2
-17.1
TRP-273
ASN-274
6.9
6.4
-2.2
-0.1
39.3
40.4
93.7
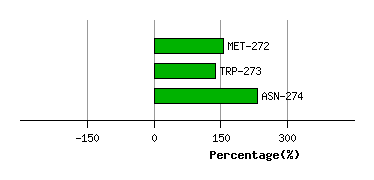
Graph shows rotational transition at bending residues and can be used
to identify hinge bending residues.
Probably only informative for interdomain rotations greater than 20 degrees
Residue
iResidue
i+1Distance of hinge axis to residue i in
(A) Distance of hinge axis to residue i in
(A) Change in
(deg) Change in
(deg) Angle of psi(i) axis to hinge axis
(deg) Angle of psi(i) axis to hinge axis
(deg) Percentage Progress
LEU-287
GLY-288
6.3
6.3
19.0
-22.9
46.1
65.6
1.8
GLY-288
THR-289
3.1
2.9
27.3
-25.5
129.0
126.5
-21.1
THR-289
GLY-290
3.2
3.6
-11.7
6.0
27.1
25.8
40.4
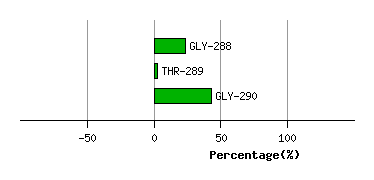
Graph shows rotational transition at bending residues and can be used
to identify hinge bending residues.
Probably only informative for interdomain rotations greater than 20 degrees