Aspartyl Trna Synthetase
(All numbering and residues are taken from first PDB file)
![]()
![]()
Bending Residue Dihedral Analysis
Residue
iResidue
i+1Distance of hinge axis to residue i in
(A) Distance of hinge axis to residue i in
(A) Change in
(deg) Change in
(deg) Angle of psi(i) axis to hinge axis
(deg) Angle of psi(i) axis to hinge axis
(deg) Percentage Progress
GLU-235
THR-236
6.9
6.7
7.2
-10.0
128.7
129.3
29.5
THR-236
SER-237
7.6
7.4
-0.6
-0.2
21.6
25.8
4.7
SER-237
PHE-238
7.4
7.1
-15.5
14.3
71.3
71.6
8.2
PHE-238
MET-239
8.0
7.8
0.4
2.8
51.6
49.3
1.5
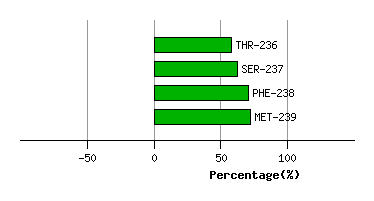
Graph shows rotational transition at bending residues and can be used
to identify hinge bending residues.
Probably only informative for interdomain rotations greater than 20 degrees
Residue
iResidue
i+1Distance of hinge axis to residue i in
(A) Distance of hinge axis to residue i in
(A) Change in
(deg) Change in
(deg) Angle of psi(i) axis to hinge axis
(deg) Angle of psi(i) axis to hinge axis
(deg) Percentage Progress
ALA-250
LEU-251
14.7
15.4
14.4
-5.7
52.8
56.2
57.6
LEU-251
VAL-252
13.2
13.6
-19.1
15.4
159.6
163.3
-20.1
VAL-252
ARG-253
11.8
12.3
-4.1
4.0
118.5
113.6
-23.1
ARG-253
HIS-254
15.2
15.8
-0.5
-4.8
107.3
103.3
-22.7
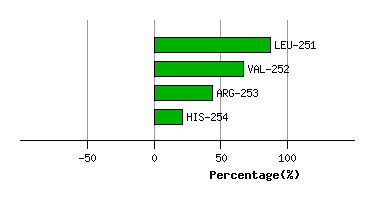
Graph shows rotational transition at bending residues and can be used
to identify hinge bending residues.
Probably only informative for interdomain rotations greater than 20 degrees
Residue
iResidue
i+1Distance of hinge axis to residue i in
(A) Distance of hinge axis to residue i in
(A) Change in
(deg) Change in
(deg) Angle of psi(i) axis to hinge axis
(deg) Angle of psi(i) axis to hinge axis
(deg) Percentage Progress
PRO-268
VAL-269
16.8
16.9
-7.9
1.5
57.4
57.4
100.5
VAL-269
MET-270
15.3
15.3
21.4
-21.5
92.2
86.6
20.3
MET-270
THR-271
15.7
15.9
11.1
-10.2
123.7
125.0
-23.9
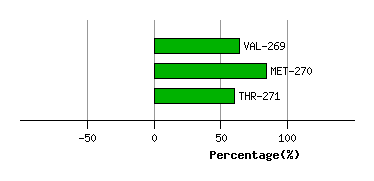
Graph shows rotational transition at bending residues and can be used
to identify hinge bending residues.
Probably only informative for interdomain rotations greater than 20 degrees
Residue
iResidue
i+1Distance of hinge axis to residue i in
(A) Distance of hinge axis to residue i in
(A) Change in
(deg) Change in
(deg) Angle of psi(i) axis to hinge axis
(deg) Angle of psi(i) axis to hinge axis
(deg) Percentage Progress
LYS-424
TRP-425
15.8
16.1
-19.0
14.8
128.3
132.0
-58.9
TRP-425
ALA-426
13.9
14.2
-8.8
7.2
136.7
137.0
-4.4
ALA-426
PRO-427
13.8
14.0
-2.3
7.8
139.3
140.2
28.5
PRO-427
LEU-428
12.2
12.3
8.4
-4.3
39.7
47.0
24.2
LEU-428
TRP-429
12.3
12.5
2.1
-5.5
48.7
49.2
-3.1
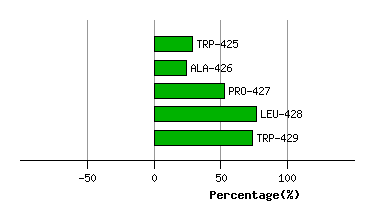
Graph shows rotational transition at bending residues and can be used
to identify hinge bending residues.
Probably only informative for interdomain rotations greater than 20 degrees
Residue
iResidue
i+1Distance of hinge axis to residue i in
(A) Distance of hinge axis to residue i in
(A) Change in
(deg) Change in
(deg) Angle of psi(i) axis to hinge axis
(deg) Angle of psi(i) axis to hinge axis
(deg) Percentage Progress
VAL-430
ILE-431
11.1
11.1
7.9
-6.5
154.7
153.5
-40.4
ILE-431
ASP-432
11.0
11.0
6.2
-10.0
111.8
111.8
22.0
ASP-432
PHE-433
12.5
12.5
-1.1
8.9
116.4
120.8
41.2
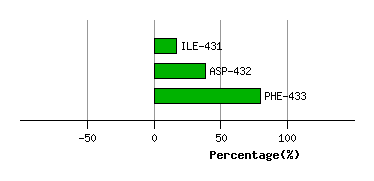
Graph shows rotational transition at bending residues and can be used
to identify hinge bending residues.
Probably only informative for interdomain rotations greater than 20 degrees
Residue
iResidue
i+1Distance of hinge axis to residue i in
(A) Distance of hinge axis to residue i in
(A) Change in
(deg) Change in
(deg) Angle of psi(i) axis to hinge axis
(deg) Angle of psi(i) axis to hinge axis
(deg) Percentage Progress
PRO-434
MET-435
13.9
14.4
2.0
-12.9
74.2
63.8
-37.5
MET-435
PHE-436
12.6
13.3
-4.0
10.5
60.7
71.9
31.0
PHE-436
GLU-437
15.3
16.0
35.1
-50.9
144.9
151.3
103.7
GLU-437
ASP-438
17.3
18.7
31.3
-35.5
91.5
91.8
17.1
GLU-437
ASP-438
17.3
18.7
31.3
-35.5
91.5
91.8
17.1
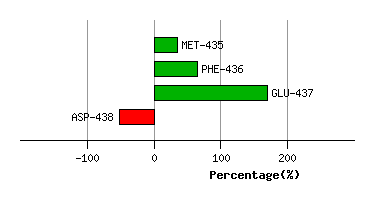
Graph shows rotational transition at bending residues and can be used
to identify hinge bending residues.
Probably only informative for interdomain rotations greater than 20 degrees
Residue
iResidue
i+1Distance of hinge axis to residue i in
(A) Distance of hinge axis to residue i in
(A) Change in
(deg) Change in
(deg) Angle of psi(i) axis to hinge axis
(deg) Angle of psi(i) axis to hinge axis
(deg) Percentage Progress
GLU-437
ASP-438
17.3
18.7
31.3
-35.5
91.5
91.8
17.1
GLU-437
ASP-438
17.3
18.7
31.3
-35.5
91.5
91.8
17.1
ASP-438
ASP-439
20.8
21.7
-1.2
-20.1
123.2
120.0
-17.4
ASP-439
GLY-440
21.0
21.5
121.5
-27.9
52.7
74.2
393.2
GLY-440
GLU-441
24.2
24.3
-78.8
27.1
72.2
72.5
234.8
GLU-441
GLY-442
26.2
27.1
-18.8
-3.0
21.4
53.7
169.1
GLY-442
GLY-443
26.8
25.2
-96.3
177.9
51.0
30.4
-625.7
GLY-443
LEU-444
23.4
24.5
46.1
-52.7
70.7
89.0
-11.1
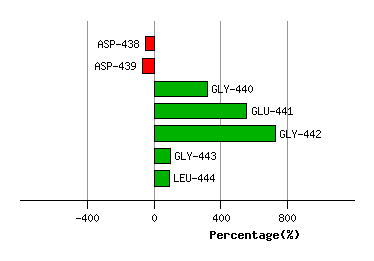
Graph shows rotational transition at bending residues and can be used
to identify hinge bending residues.
Probably only informative for interdomain rotations greater than 20 degrees
Residue
iResidue
i+1Distance of hinge axis to residue i in
(A) Distance of hinge axis to residue i in
(A) Change in
(deg) Change in
(deg) Angle of psi(i) axis to hinge axis
(deg) Angle of psi(i) axis to hinge axis
(deg) Percentage Progress
MET-447
HIS-448
11.7
12.3
23.3
-31.8
105.0
97.1
-18.3
HIS-448
HIS-449
8.2
9.1
-105.0
109.6
108.4
128.9
26.4
HIS-449
PRO-450
9.4
9.4
-9.9
-9.0
165.5
149.5
-156.4
PRO-450
PHE-451
11.0
11.1
14.8
4.3
47.0
42.2
145.0
PHE-451
THR-452
7.7
7.9
-9.0
5.5
86.8
83.5
-6.5
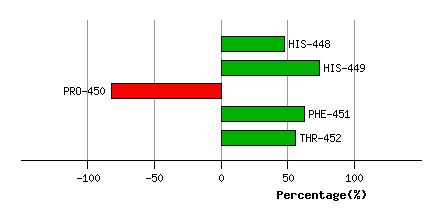
Graph shows rotational transition at bending residues and can be used
to identify hinge bending residues.
Probably only informative for interdomain rotations greater than 20 degrees
Residue
iResidue
i+1Distance of hinge axis to residue i in
(A) Distance of hinge axis to residue i in
(A) Change in
(deg) Change in
(deg) Angle of psi(i) axis to hinge axis
(deg) Angle of psi(i) axis to hinge axis
(deg) Percentage Progress
SER-453
PRO-454
6.6
7.4
7.9
13.5
106.3
110.0
-68.9
PRO-454
LYS-455
10.0
10.7
12.3
-31.9
75.2
85.0
43.9
LYS-455
ASP-456
10.9
11.5
8.4
8.5
21.3
42.7
160.3
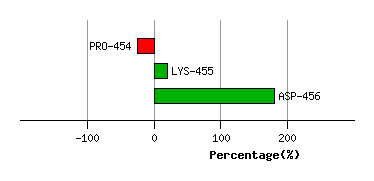
Graph shows rotational transition at bending residues and can be used
to identify hinge bending residues.
Probably only informative for interdomain rotations greater than 20 degrees
Residue
iResidue
i+1Distance of hinge axis to residue i in
(A) Distance of hinge axis to residue i in
(A) Change in
(deg) Change in
(deg) Angle of psi(i) axis to hinge axis
(deg) Angle of psi(i) axis to hinge axis
(deg) Percentage Progress
MET-457
THR-458
14.5
15.1
11.8
-5.0
133.3
141.4
-15.2
THR-458
ALA-459
13.8
14.6
-1.7
-2.9
100.4
99.9
14.7
ALA-459
ALA-460
13.9
14.2
4.3
-12.2
97.3
94.0
18.9
ALA-460
GLU-461
17.4
17.8
12.1
-6.0
38.9
41.7
30.5
GLU-461
LEU-462
18.6
19.1
-0.8
-3.2
146.4
146.1
-46.0
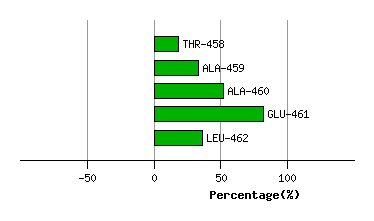
Graph shows rotational transition at bending residues and can be used
to identify hinge bending residues.
Probably only informative for interdomain rotations greater than 20 degrees
Residue
iResidue
i+1Distance of hinge axis to residue i in
(A) Distance of hinge axis to residue i in
(A) Change in
(deg) Change in
(deg) Angle of psi(i) axis to hinge axis
(deg) Angle of psi(i) axis to hinge axis
(deg) Percentage Progress
ALA-464
ALA-465
22.1
22.3
13.1
-8.3
17.8
22.3
40.7
ALA-465
PRO-466
21.8
22.2
1.7
-11.5
55.2
52.2
10.3
PRO-466
GLU-467
19.0
19.6
6.6
16.9
20.7
11.0
182.6
GLU-467
ASN-468
20.3
21.3
-16.5
-24.0
96.2
121.7
-98.7
ASN-468
ALA-469
19.9
19.9
22.2
10.8
107.6
118.0
-90.6
ALA-469
VAL-470
16.4
17.1
9.0
-5.7
45.1
49.7
-1.1
VAL-470
ALA-471
14.2
14.6
-18.2
23.3
103.7
106.8
15.1
VAL-470
ALA-471
14.2
14.6
-18.2
23.3
103.7
106.8
15.1
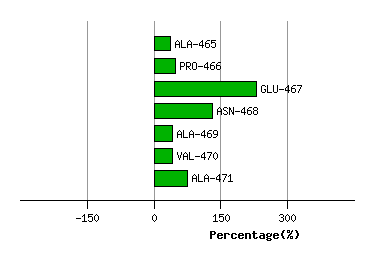
Graph shows rotational transition at bending residues and can be used
to identify hinge bending residues.
Probably only informative for interdomain rotations greater than 20 degrees
Residue
iResidue
i+1Distance of hinge axis to residue i in
(A) Distance of hinge axis to residue i in
(A) Change in
(deg) Change in
(deg) Angle of psi(i) axis to hinge axis
(deg) Angle of psi(i) axis to hinge axis
(deg) Percentage Progress
VAL-470
ALA-471
14.2
14.6
-18.2
23.3
103.7
106.8
15.1
VAL-470
ALA-471
14.2
14.6
-18.2
23.3
103.7
106.8
15.1
ALA-471
ASN-472
10.5
10.9
-1.2
-3.8
89.1
89.0
38.0
ASN-472
ALA-473
7.9
8.4
-9.7
11.3
39.1
46.6
-12.5
ALA-473
TYR-474
6.7
6.8
2.5
8.0
44.7
44.9
55.0
ALA-473
TYR-474
6.7
6.8
2.5
8.0
44.7
44.9
55.0
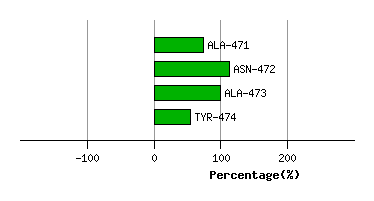
Graph shows rotational transition at bending residues and can be used
to identify hinge bending residues.
Probably only informative for interdomain rotations greater than 20 degrees
Residue
iResidue
i+1Distance of hinge axis to residue i in
(A) Distance of hinge axis to residue i in
(A) Change in
(deg) Change in
(deg) Angle of psi(i) axis to hinge axis
(deg) Angle of psi(i) axis to hinge axis
(deg) Percentage Progress
ALA-473
TYR-474
6.7
6.8
2.5
8.0
44.7
44.9
55.0
ALA-473
TYR-474
6.7
6.8
2.5
8.0
44.7
44.9
55.0
TYR-474
ASP-475
6.8
6.7
5.8
-5.6
34.3
32.6
14.3
ASP-475
MET-476
5.9
6.1
-3.7
-1.0
118.0
118.7
-31.2
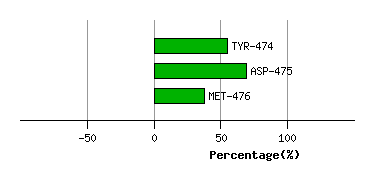
Graph shows rotational transition at bending residues and can be used
to identify hinge bending residues.
Probably only informative for interdomain rotations greater than 20 degrees
Residue
iResidue
i+1Distance of hinge axis to residue i in
(A) Distance of hinge axis to residue i in
(A) Change in
(deg) Change in
(deg) Angle of psi(i) axis to hinge axis
(deg) Angle of psi(i) axis to hinge axis
(deg) Percentage Progress
TYR-481
GLU-482
5.4
5.2
-12.8
19.4
166.6
164.3
53.9
GLU-482
VAL-483
4.1
4.0
22.2
-32.1
90.4
95.7
-7.5
VAL-483
GLY-484
2.6
2.8
20.4
-4.6
30.7
26.9
124.1
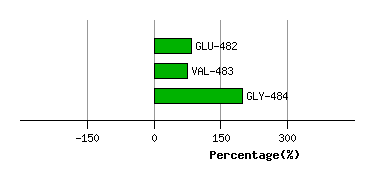
Graph shows rotational transition at bending residues and can be used
to identify hinge bending residues.
Probably only informative for interdomain rotations greater than 20 degrees
Residue
iResidue
i+1Distance of hinge axis to residue i in
(A) Distance of hinge axis to residue i in
(A) Change in
(deg) Change in
(deg) Angle of psi(i) axis to hinge axis
(deg) Angle of psi(i) axis to hinge axis
(deg) Percentage Progress
VAL-488
ARG-489
2.4
2.9
-2.7
0.9
67.9
66.0
3.4
ARG-489
ILE-490
2.5
2.8
-1.0
2.8
24.5
24.3
1.7
ILE-490
HIS-491
4.6
4.6
12.8
-10.0
129.0
132.4
20.5
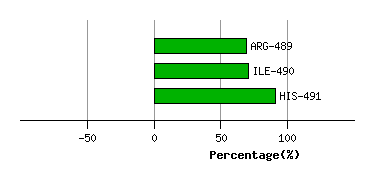
Graph shows rotational transition at bending residues and can be used
to identify hinge bending residues.
Probably only informative for interdomain rotations greater than 20 degrees
Residue
iResidue
i+1Distance of hinge axis to residue i in
(A) Distance of hinge axis to residue i in
(A) Change in
(deg) Change in
(deg) Angle of psi(i) axis to hinge axis
(deg) Angle of psi(i) axis to hinge axis
(deg) Percentage Progress
PHE-500
GLY-501
16.0
16.0
-7.8
2.7
97.5
99.0
35.0
GLY-501
ILE-502
18.9
18.9
12.1
-8.4
136.1
139.0
-42.1
ILE-502
LEU-503
19.0
19.1
-4.2
-1.5
30.1
36.8
81.9
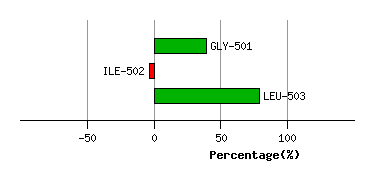
Graph shows rotational transition at bending residues and can be used
to identify hinge bending residues.
Probably only informative for interdomain rotations greater than 20 degrees
Residue
iResidue
i+1Distance of hinge axis to residue i in
(A) Distance of hinge axis to residue i in
(A) Change in
(deg) Change in
(deg) Angle of psi(i) axis to hinge axis
(deg) Angle of psi(i) axis to hinge axis
(deg) Percentage Progress
ILE-505
ASN-506
21.1
19.9
-23.9
5.7
8.0
15.7
169.8
ASN-506
GLU-507
22.7
21.8
19.5
-17.7
122.5
109.9
19.1
GLU-507
GLU-508
21.6
21.0
3.3
-1.6
75.9
62.2
-55.7
GLU-508
GLU-509
24.1
23.4
0.9
12.2
33.3
32.4
119.7
GLU-509
GLN-510
22.8
21.5
-20.2
16.8
83.8
79.9
-41.2
GLN-510
ARG-511
19.2
18.1
-5.2
-5.6
64.5
79.8
-5.2
ARG-511
GLU-512
20.4
19.6
33.6
-30.5
49.5
43.6
-34.6
GLU-512
LYS-513
22.4
21.2
-3.2
24.2
144.8
140.8
138.9
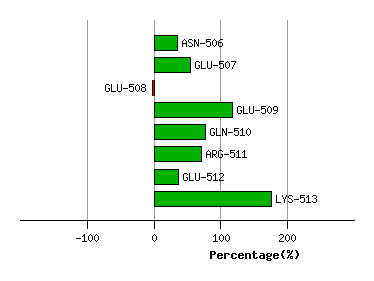
Graph shows rotational transition at bending residues and can be used
to identify hinge bending residues.
Probably only informative for interdomain rotations greater than 20 degrees
Residue
iResidue
i+1Distance of hinge axis to residue i in
(A) Distance of hinge axis to residue i in
(A) Change in
(deg) Change in
(deg) Angle of psi(i) axis to hinge axis
(deg) Angle of psi(i) axis to hinge axis
(deg) Percentage Progress
PRO-526
PRO-527
4.7
4.3
2.4
-4.6
135.4
136.3
-10.7
PRO-527
HIS-528
2.8
2.7
-12.6
15.8
31.8
33.7
-14.6
HIS-528
ALA-529
3.3
3.1
17.9
-26.8
142.5
143.2
84.5
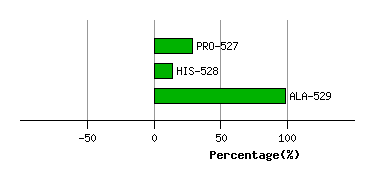
Graph shows rotational transition at bending residues and can be used
to identify hinge bending residues.
Probably only informative for interdomain rotations greater than 20 degrees