Sarcoplasmic/endoplasmic Reticulum Calcium Atpase 1
(All numbering and residues are taken from first PDB file)
![]()
![]()
Bending Residue Dihedral Analysis
Residue
iResidue
i+1Distance of hinge axis to residue i in
(A) Distance of hinge axis to residue i in
(A) Change in
(deg) Change in
(deg) Angle of psi(i) axis to hinge axis
(deg) Angle of psi(i) axis to hinge axis
(deg) Percentage Progress
LEU-41
PRO-42
15.3
14.8
-24.9
-5.6
128.8
137.4
-60.2
PRO-42
ALA-43
14.7
14.1
61.3
-62.5
61.4
48.1
-3.7
ALA-43
GLU-44
11.3
12.5
-93.2
19.2
164.6
145.7
-168.8
GLU-44
GLU-45
11.5
15.6
-174.0
-29.2
129.2
140.2
425.8
GLU-45
GLY-46
10.7
14.9
21.4
35.9
78.4
60.7
56.4
GLY-46
LYS-47
7.0
12.4
56.4
-42.9
22.6
110.7
38.5
LYS-47
SER-48
6.9
9.4
-73.8
-81.7
108.9
110.9
-83.0
SER-48
LEU-49
3.8
6.6
-22.4
-81.4
171.7
161.6
-272.2
LEU-49
TRP-50
3.4
5.9
-164.3
-13.7
106.5
112.6
237.5
TRP-50
GLU-51
0.4
4.1
125.2
28.3
78.8
61.4
358.0
GLU-51
LEU-52
3.8
1.1
-8.2
19.6
154.4
156.9
22.5
LEU-52
VAL-53
4.4
1.1
-171.4
0.1
139.9
140.9
-439.7
VAL-53
ILE-54
1.2
0.5
-16.7
52.5
91.9
123.3
8.6
ILE-54
GLU-55
3.7
3.2
47.3
-9.4
96.6
104.2
-13.3
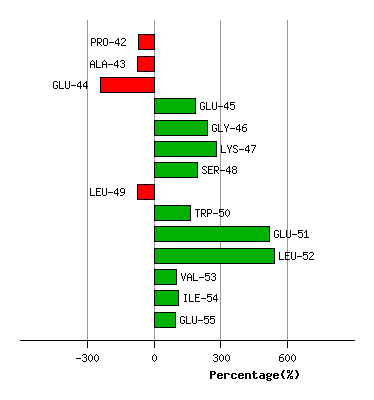
Graph shows rotational transition at bending residues and can be used
to identify hinge bending residues.
Probably only informative for interdomain rotations greater than 20 degrees
Residue
iResidue
i+1Distance of hinge axis to residue i in
(A) Distance of hinge axis to residue i in
(A) Change in
(deg) Change in
(deg) Angle of psi(i) axis to hinge axis
(deg) Angle of psi(i) axis to hinge axis
(deg) Percentage Progress
ALA-118
LEU-119
10.2
10.3
-29.7
-0.6
114.0
123.2
-31.4
LEU-119
LYS-120
6.4
6.6
76.5
-56.7
50.9
68.9
14.6
LYS-120
GLU-121
7.2
7.6
34.0
-44.6
13.3
3.9
-22.8
GLU-121
TYR-122
7.9
6.9
111.8
-21.2
59.9
82.2
90.2
TYR-122
GLU-123
4.4
3.3
-119.2
-41.2
90.0
147.5
-199.0
GLU-123
PRO-124
3.3
3.2
-52.8
-44.1
158.0
97.6
419.4
PRO-124
GLU-125
3.3
6.7
36.5
49.5
69.1
26.4
-522.6
GLU-125
MET-126
6.0
9.1
-112.9
155.0
117.4
147.4
106.5
MET-126
GLY-127
8.1
8.0
-52.5
150.9
99.6
136.9
117.0
GLY-127
LYS-128
11.0
11.3
38.2
5.8
37.5
38.6
91.3
LYS-128
VAL-129
11.7
11.9
3.3
3.6
86.6
87.8
2.8
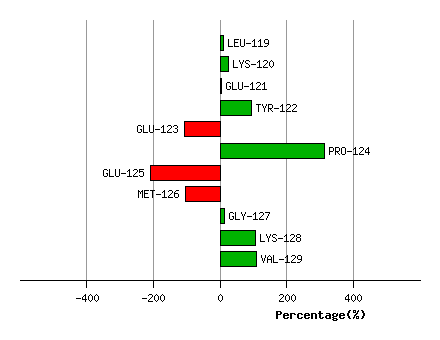
Graph shows rotational transition at bending residues and can be used
to identify hinge bending residues.
Probably only informative for interdomain rotations greater than 20 degrees
Residue
iResidue
i+1Distance of hinge axis to residue i in
(A) Distance of hinge axis to residue i in
(A) Change in
(deg) Change in
(deg) Angle of psi(i) axis to hinge axis
(deg) Angle of psi(i) axis to hinge axis
(deg) Percentage Progress
ARG-236
ASP-237
19.6
18.5
-36.7
19.8
137.8
143.1
-36.4
ASP-237
GLN-238
20.4
19.0
-26.6
-10.5
150.4
138.6
-81.3
GLN-238
MET-239
21.7
21.8
57.6
7.6
70.0
80.7
45.2
MET-239
ALA-240
18.1
20.0
173.2
-24.4
88.4
22.3
332.6
ALA-240
ALA-241
16.7
19.3
-139.0
48.2
138.9
97.7
-137.3
ALA-241
THR-242
15.3
15.9
135.4
-4.2
42.6
92.0
108.3
THR-242
GLU-243
17.2
13.6
61.0
43.9
98.3
44.0
-247.4
GLU-243
GLN-244
15.1
12.1
-2.0
5.7
135.9
64.5
37.0
GLN-244
ASP-245
13.5
10.1
73.3
70.6
117.8
48.8
22.8
ASP-245
LYS-246
11.8
10.7
39.2
22.4
92.9
81.4
35.0
LYS-246
THR-247
9.0
8.4
-3.0
-11.6
67.7
74.3
19.9
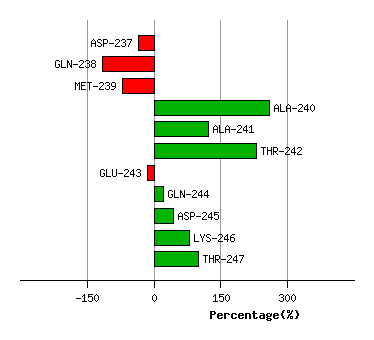
Graph shows rotational transition at bending residues and can be used
to identify hinge bending residues.
Probably only informative for interdomain rotations greater than 20 degrees