Cell Division Protein Kinase 2
(All numbering and residues are taken from first PDB file)
![]()
![]()
Bending Residue Dihedral Analysis
Residue
iResidue
i+1Distance of hinge axis to residue i in
(A) Distance of hinge axis to residue i in
(A) Change in
(deg) Change in
(deg) Angle of psi(i) axis to hinge axis
(deg) Angle of psi(i) axis to hinge axis
(deg) Percentage Progress
LEU-32
LYS-33
12.0
11.8
6.6
-14.5
67.9
70.3
-12.2
LYS-33
LYS-34
11.1
11.1
16.9
-15.5
33.0
42.7
-13.4
LYS-34
ILE-35
10.3
10.1
-16.6
40.5
108.9
92.7
24.9
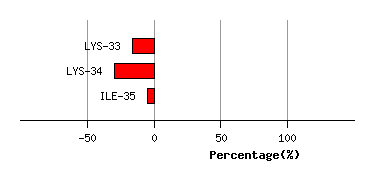
Graph shows rotational transition at bending residues and can be used
to identify hinge bending residues.
Probably only informative for interdomain rotations greater than 20 degrees
Residue
iResidue
i+1Distance of hinge axis to residue i in
(A) Distance of hinge axis to residue i in
(A) Change in
(deg) Change in
(deg) Angle of psi(i) axis to hinge axis
(deg) Angle of psi(i) axis to hinge axis
(deg) Percentage Progress
LYS-56
GLU-57
1.6
1.2
-16.0
0.2
146.6
155.1
-53.5
GLU-57
LEU-58
3.6
2.0
15.5
11.5
38.3
41.0
79.8
LEU-58
ASN-59
3.7
3.5
-25.7
12.2
97.1
101.8
20.8
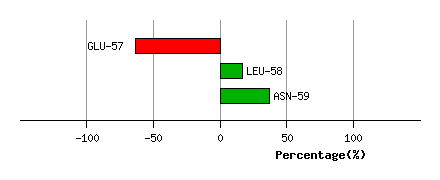
Graph shows rotational transition at bending residues and can be used
to identify hinge bending residues.
Probably only informative for interdomain rotations greater than 20 degrees
Residue
iResidue
i+1Distance of hinge axis to residue i in
(A) Distance of hinge axis to residue i in
(A) Change in
(deg) Change in
(deg) Angle of psi(i) axis to hinge axis
(deg) Angle of psi(i) axis to hinge axis
(deg) Percentage Progress
VAL-69
ILE-70
3.1
1.9
-17.8
20.5
145.0
151.2
15.3
ILE-70
HIS-71
4.2
2.5
-0.8
5.4
133.6
130.3
15.3
HIS-71
THR-72
1.4
0.6
-24.0
-18.8
152.7
152.5
-109.7
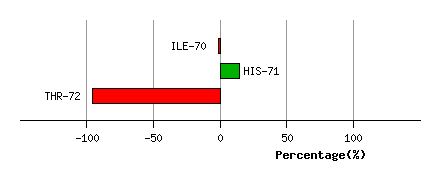
Graph shows rotational transition at bending residues and can be used
to identify hinge bending residues.
Probably only informative for interdomain rotations greater than 20 degrees
Residue
iResidue
i+1Distance of hinge axis to residue i in
(A) Distance of hinge axis to residue i in
(A) Change in
(deg) Change in
(deg) Angle of psi(i) axis to hinge axis
(deg) Angle of psi(i) axis to hinge axis
(deg) Percentage Progress
LYS-75
LEU-76
4.9
4.6
18.4
8.5
26.0
22.8
118.6
LEU-76
TYR-77
4.4
4.8
9.0
-10.3
53.2
70.5
-0.7
TYR-77
LEU-78
6.3
5.8
-7.8
6.3
161.8
166.9
-2.9
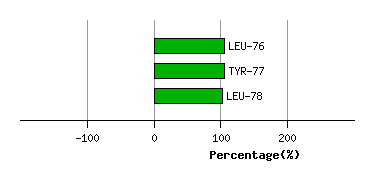
Graph shows rotational transition at bending residues and can be used
to identify hinge bending residues.
Probably only informative for interdomain rotations greater than 20 degrees