Uridylate Kinase
(All numbering and residues are taken from first PDB file)
![]()
![]()
Bending Residue Dihedral Analysis
Residue
iResidue
i+1Distance of hinge axis to residue i in
(A) Distance of hinge axis to residue i in
(A) Change in
(deg) Change in
(deg) Angle of psi(i) axis to hinge axis
(deg) Angle of psi(i) axis to hinge axis
(deg) Percentage Progress
VAL-161
LEU-162
3.7
3.7
-5.1
2.5
58.0
55.2
17.4
LEU-162
LYS-163
2.1
2.3
-3.9
4.3
82.2
81.2
7.1
LYS-163
ALA-164
5.1
5.4
10.5
-19.0
142.6
147.6
62.4
ALA-164
THR-165
6.3
6.5
-28.6
39.9
98.3
89.0
9.6
THR-165
LYS-166
9.7
9.8
37.4
-21.0
142.2
148.5
-129.9
LYS-166
VAL-167
11.9
12.3
-30.0
8.0
102.6
91.7
18.6
LYS-166
VAL-167
11.9
12.3
-30.0
8.0
102.6
91.7
18.6
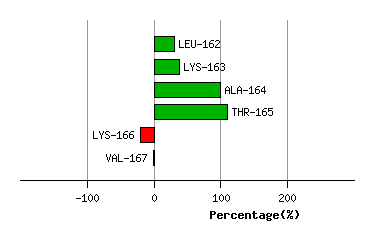
Graph shows rotational transition at bending residues and can be used
to identify hinge bending residues.
Probably only informative for interdomain rotations greater than 20 degrees
Residue
iResidue
i+1Distance of hinge axis to residue i in
(A) Distance of hinge axis to residue i in
(A) Change in
(deg) Change in
(deg) Angle of psi(i) axis to hinge axis
(deg) Angle of psi(i) axis to hinge axis
(deg) Percentage Progress
LYS-166
VAL-167
11.9
12.3
-30.0
8.0
102.6
91.7
18.6
LYS-166
VAL-167
11.9
12.3
-30.0
8.0
102.6
91.7
18.6
VAL-167
ASP-168
12.2
12.5
10.8
2.3
86.0
80.2
23.6
ASP-168
GLY-169
10.9
11.1
-1.9
13.0
152.7
154.3
113.8
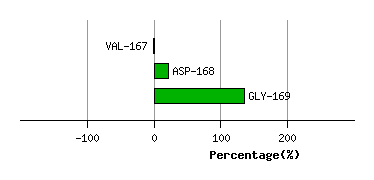
Graph shows rotational transition at bending residues and can be used
to identify hinge bending residues.
Probably only informative for interdomain rotations greater than 20 degrees
Residue
iResidue
i+1Distance of hinge axis to residue i in
(A) Distance of hinge axis to residue i in
(A) Change in
(deg) Change in
(deg) Angle of psi(i) axis to hinge axis
(deg) Angle of psi(i) axis to hinge axis
(deg) Percentage Progress
THR-182
MET-183
19.1
19.2
9.4
-33.3
101.9
105.1
24.2
MET-183
TYR-184
15.4
15.5
3.6
-2.2
127.9
113.5
-40.8
TYR-184
GLU-185
13.6
14.0
24.1
-23.0
59.3
60.1
2.5
GLU-185
GLN-186
12.4
12.1
16.7
-1.8
128.4
132.4
-69.4
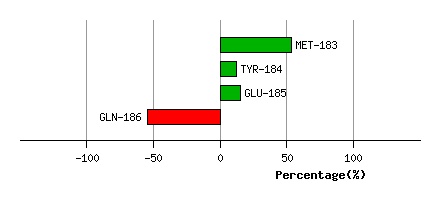
Graph shows rotational transition at bending residues and can be used
to identify hinge bending residues.
Probably only informative for interdomain rotations greater than 20 degrees
Residue
iResidue
i+1Distance of hinge axis to residue i in
(A) Distance of hinge axis to residue i in
(A) Change in
(deg) Change in
(deg) Angle of psi(i) axis to hinge axis
(deg) Angle of psi(i) axis to hinge axis
(deg) Percentage Progress
THR-188
TYR-189
7.3
7.5
0.9
-4.3
112.4
105.4
105.7
TYR-189
SER-190
5.7
5.3
30.0
-18.7
132.3
130.8
-15.6
SER-190
GLU-191
7.8
8.0
-33.3
33.4
111.5
116.0
26.2
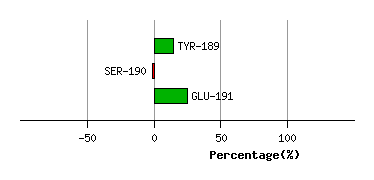
Graph shows rotational transition at bending residues and can be used
to identify hinge bending residues.
Probably only informative for interdomain rotations greater than 20 degrees
Residue
iResidue
i+1Distance of hinge axis to residue i in
(A) Distance of hinge axis to residue i in
(A) Change in
(deg) Change in
(deg) Angle of psi(i) axis to hinge axis
(deg) Angle of psi(i) axis to hinge axis
(deg) Percentage Progress
HIS-211
LYS-212
5.7
6.0
8.2
1.7
125.8
122.0
-71.8
LYS-212
LEU-213
3.6
4.2
-12.9
-0.2
17.6
10.3
134.4
LEU-213
PRO-214
3.8
3.8
4.5
-8.5
122.1
118.9
-8.3
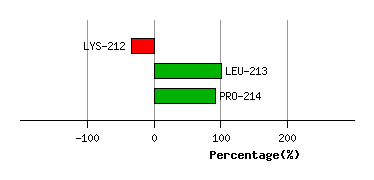
Graph shows rotational transition at bending residues and can be used
to identify hinge bending residues.
Probably only informative for interdomain rotations greater than 20 degrees
Residue
iResidue
i+1Distance of hinge axis to residue i in
(A) Distance of hinge axis to residue i in
(A) Change in
(deg) Change in
(deg) Angle of psi(i) axis to hinge axis
(deg) Angle of psi(i) axis to hinge axis
(deg) Percentage Progress
PHE-218
ASN-219
6.1
6.1
-3.6
1.6
129.0
128.7
-5.2
ASN-219
MET-220
7.7
7.9
3.5
-7.9
47.6
45.0
-50.8
MET-220
ASN-221
6.3
6.6
7.7
5.4
23.0
29.5
133.1
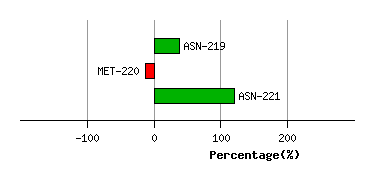
Graph shows rotational transition at bending residues and can be used
to identify hinge bending residues.
Probably only informative for interdomain rotations greater than 20 degrees
Residue
iResidue
i+1Distance of hinge axis to residue i in
(A) Distance of hinge axis to residue i in
(A) Change in
(deg) Change in
(deg) Angle of psi(i) axis to hinge axis
(deg) Angle of psi(i) axis to hinge axis
(deg) Percentage Progress
ARG-227
ARG-228
4.3
3.9
1.1
-0.9
60.1
61.3
-0.3
ARG-228
VAL-229
6.7
6.3
3.1
-1.4
11.1
11.1
29.2
VAL-229
VAL-230
5.2
4.9
1.6
12.0
74.9
81.2
-17.0
VAL-230
MET-231
6.1
6.0
-9.5
-2.1
102.7
97.7
-5.6
VAL-230
MET-231
6.1
6.0
-9.5
-2.1
102.7
97.7
-5.6
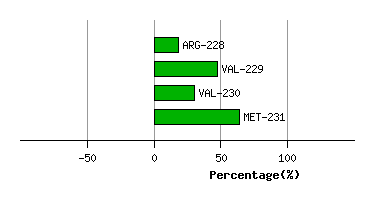
Graph shows rotational transition at bending residues and can be used
to identify hinge bending residues.
Probably only informative for interdomain rotations greater than 20 degrees
Residue
iResidue
i+1Distance of hinge axis to residue i in
(A) Distance of hinge axis to residue i in
(A) Change in
(deg) Change in
(deg) Angle of psi(i) axis to hinge axis
(deg) Angle of psi(i) axis to hinge axis
(deg) Percentage Progress
VAL-230
MET-231
6.1
6.0
-9.5
-2.1
102.7
97.7
-5.6
VAL-230
MET-231
6.1
6.0
-9.5
-2.1
102.7
97.7
-5.6
MET-231
GLY-232
9.2
9.1
-4.7
0.9
53.6
49.2
34.5
GLY-232
GLU-233
9.9
9.6
11.1
-19.6
70.6
67.0
-78.2
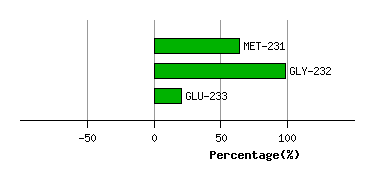
Graph shows rotational transition at bending residues and can be used
to identify hinge bending residues.
Probably only informative for interdomain rotations greater than 20 degrees
Residue
iResidue
i+1Distance of hinge axis to residue i in
(A) Distance of hinge axis to residue i in
(A) Change in
(deg) Change in
(deg) Angle of psi(i) axis to hinge axis
(deg) Angle of psi(i) axis to hinge axis
(deg) Percentage Progress
GLU-235
GLY-236
8.6
8.4
2.8
3.7
36.1
38.7
46.7
GLY-236
THR-237
8.3
8.1
-0.8
0.6
156.1
156.5
-12.4
THR-237
LEU-238
8.1
8.3
-11.4
4.9
114.7
118.3
-64.5
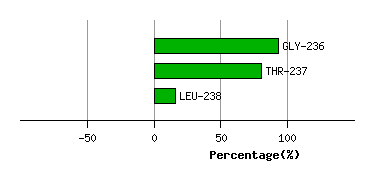
Graph shows rotational transition at bending residues and can be used
to identify hinge bending residues.
Probably only informative for interdomain rotations greater than 20 degrees