Proto-Oncogene Tyrosine-Protein Kinase Src
(All numbering and residues are taken from first PDB file)
![]()
![]()
Bending Residue Dihedral Analysis
Residue
iResidue
i+1Distance of hinge axis to residue i in
(A) Distance of hinge axis to residue i in
(A) Change in
(deg) Change in
(deg) Angle of psi(i) axis to hinge axis
(deg) Angle of psi(i) axis to hinge axis
(deg) Percentage Progress
LYS-316
LEU-317
4.4
4.4
-15.1
44.6
144.2
147.3
124.5
LEU-317
ARG-318
5.1
5.5
0.6
0.3
61.8
60.0
27.1
ARG-318
HIS-319
5.8
6.2
-8.7
2.8
131.2
139.3
-17.7
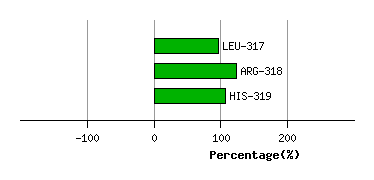
Graph shows rotational transition at bending residues and can be used
to identify hinge bending residues.
Probably only informative for interdomain rotations greater than 20 degrees
Residue
iResidue
i+1Distance of hinge axis to residue i in
(A) Distance of hinge axis to residue i in
(A) Change in
(deg) Change in
(deg) Angle of psi(i) axis to hinge axis
(deg) Angle of psi(i) axis to hinge axis
(deg) Percentage Progress
LEU-325
TYR-326
3.4
3.1
-26.6
31.5
112.2
129.9
15.7
TYR-326
ALA-327
6.9
5.6
-10.5
12.4
151.2
150.3
1.7
ALA-327
VAL-328
8.2
7.6
-6.8
-1.5
88.8
84.9
33.7
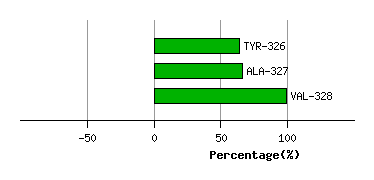
Graph shows rotational transition at bending residues and can be used
to identify hinge bending residues.
Probably only informative for interdomain rotations greater than 20 degrees
Residue
iResidue
i+1Distance of hinge axis to residue i in
(A) Distance of hinge axis to residue i in
(A) Change in
(deg) Change in
(deg) Angle of psi(i) axis to hinge axis
(deg) Angle of psi(i) axis to hinge axis
(deg) Percentage Progress
MET-341
SER-342
5.4
6.4
6.2
-18.5
36.6
35.4
-33.2
SER-342
LYS-343
7.6
8.8
9.7
30.5
42.3
32.0
145.1
LYS-343
GLY-344
5.6
6.3
-24.6
17.1
78.5
85.5
25.0
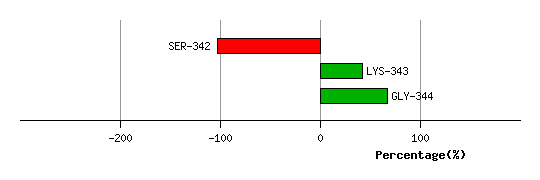
Graph shows rotational transition at bending residues and can be used
to identify hinge bending residues.
Probably only informative for interdomain rotations greater than 20 degrees
Residue
iResidue
i+1Distance of hinge axis to residue i in
(A) Distance of hinge axis to residue i in
(A) Change in
(deg) Change in
(deg) Angle of psi(i) axis to hinge axis
(deg) Angle of psi(i) axis to hinge axis
(deg) Percentage Progress
VAL-402
ALA-403
5.3
5.4
-4.2
1.7
125.0
128.6
-5.1
ALA-403
ASP-404
5.2
5.3
-6.1
-10.2
112.5
111.1
-41.8
ASP-404
PHE-405
8.3
8.4
-17.2
41.0
131.4
113.9
39.7
PHE-405
GLY-406
8.4
9.4
116.0
-14.5
49.9
72.7
218.5
GLY-406
LEU-407
11.3
13.1
89.0
43.8
67.8
7.5
-824.7
LEU-407
ALA-408
13.6
12.4
-22.8
-31.1
109.3
108.6
1005.6
ALA-408
ARG-409
11.7
15.9
-127.9
55.3
170.4
72.8
-196.9
PHE-424
PRO-425
22.5
22.4
-3.4
-60.9
62.6
43.8
134.7
PRO-425
ILE-426
20.6
20.2
3.2
1.5
83.8
88.2
-23.0
ILE-426
LYS-427
23.7
23.2
4.6
-4.4
136.1
134.3
-23.0
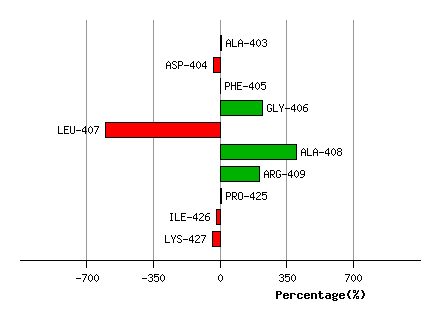
Graph shows rotational transition at bending residues and can be used
to identify hinge bending residues.
Probably only informative for interdomain rotations greater than 20 degrees