Plasmid Segregation Protein Parm
(All numbering and residues are taken from first PDB file)
![]()
![]()
Bending Residue Dihedral Analysis
Residue
iResidue
i+1Distance of hinge axis to residue i in
(A) Distance of hinge axis to residue i in
(A) Change in
(deg) Change in
(deg) Angle of psi(i) axis to hinge axis
(deg) Angle of psi(i) axis to hinge axis
(deg) Percentage Progress
ASP-6
ASP-7
8.2
8.0
1.6
-2.9
94.8
92.4
7.9
ASP-7
GLY-8
12.0
11.8
-1.4
4.7
152.5
149.5
27.0
GLY-8
SER-9
13.0
13.1
-3.4
17.4
88.3
84.2
-14.8
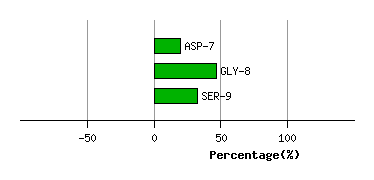
Graph shows rotational transition at bending residues and can be used
to identify hinge bending residues.
Probably only informative for interdomain rotations greater than 20 degrees
Residue
iResidue
i+1Distance of hinge axis to residue i in
(A) Distance of hinge axis to residue i in
(A) Change in
(deg) Change in
(deg) Angle of psi(i) axis to hinge axis
(deg) Angle of psi(i) axis to hinge axis
(deg) Percentage Progress
THR-10
ASN-11
17.1
17.4
19.9
-13.8
15.6
26.6
36.6
ASN-11
ILE-12
15.1
15.1
-14.9
7.4
102.4
106.6
-36.3
ILE-12
LYS-13
12.7
12.7
6.6
-6.2
71.0
77.5
14.4
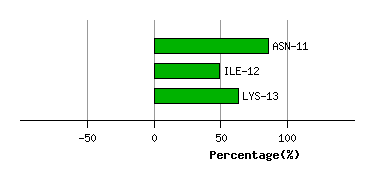
Graph shows rotational transition at bending residues and can be used
to identify hinge bending residues.
Probably only informative for interdomain rotations greater than 20 degrees
Residue
iResidue
i+1Distance of hinge axis to residue i in
(A) Distance of hinge axis to residue i in
(A) Change in
(deg) Change in
(deg) Angle of psi(i) axis to hinge axis
(deg) Angle of psi(i) axis to hinge axis
(deg) Percentage Progress
THR-101
LEU-102
9.6
9.8
2.7
-11.1
59.1
55.0
-15.6
LEU-102
PRO-103
12.0
11.9
8.4
-1.0
36.5
34.1
41.0
PRO-103
LEU-104
11.2
11.5
-2.3
-1.8
131.3
123.1
-43.2
Graph shows rotational transition at bending residues and can be used
to identify hinge bending residues.
Probably only informative for interdomain rotations greater than 20 degrees
Residue
iResidue
i+1Distance of hinge axis to residue i in
(A) Distance of hinge axis to residue i in
(A) Change in
(deg) Change in
(deg) Angle of psi(i) axis to hinge axis
(deg) Angle of psi(i) axis to hinge axis
(deg) Percentage Progress
TYR-108
ASP-109
13.8
13.9
-10.0
13.0
52.6
42.9
-19.2
ASP-109
ARG-110
16.5
16.6
-4.5
10.2
28.2
35.5
-26.7
ARG-110
ASN-111
15.8
15.6
-7.3
1.6
63.2
81.0
78.5
ASN-111
ASN-112
15.9
15.6
-11.2
5.7
124.8
130.8
22.2
ASN-112
GLN-113
13.2
13.1
7.1
-7.0
48.4
43.8
-20.5
GLN-113
PRO-114
15.8
15.8
0.6
6.6
35.9
50.8
49.0
PRO-114
ASN-115
15.8
16.0
2.1
-3.3
88.5
99.2
-2.8
ASN-115
THR-116
18.1
18.3
-21.4
18.1
158.0
155.2
-38.3
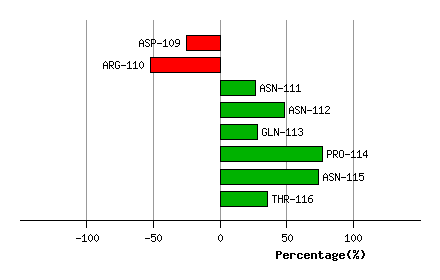
Graph shows rotational transition at bending residues and can be used
to identify hinge bending residues.
Probably only informative for interdomain rotations greater than 20 degrees
Residue
iResidue
i+1Distance of hinge axis to residue i in
(A) Distance of hinge axis to residue i in
(A) Change in
(deg) Change in
(deg) Angle of psi(i) axis to hinge axis
(deg) Angle of psi(i) axis to hinge axis
(deg) Percentage Progress
LYS-144
VAL-145
12.6
12.7
2.2
6.9
47.5
48.6
79.0
VAL-145
MET-146
11.9
11.6
15.0
-13.8
48.4
53.0
-4.5
MET-146
PRO-147
9.1
8.8
1.4
-5.8
43.7
41.5
33.0
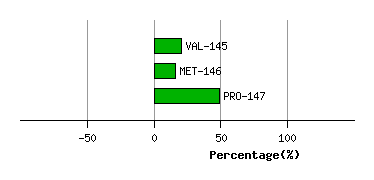
Graph shows rotational transition at bending residues and can be used
to identify hinge bending residues.
Probably only informative for interdomain rotations greater than 20 degrees
Residue
iResidue
i+1Distance of hinge axis to residue i in
(A) Distance of hinge axis to residue i in
(A) Change in
(deg) Change in
(deg) Angle of psi(i) axis to hinge axis
(deg) Angle of psi(i) axis to hinge axis
(deg) Percentage Progress
GLU-148
SER-149
6.3
6.5
4.5
-8.9
132.2
136.2
34.2
SER-149
ILE-150
3.2
3.8
-4.9
-0.1
99.8
102.2
-10.7
ILE-150
PRO-151
3.4
2.6
-0.5
4.8
143.7
142.2
49.7
PRO-151
ALA-152
2.9
2.3
5.8
-1.3
90.3
95.1
19.3
PRO-151
ALA-152
2.9
2.3
5.8
-1.3
90.3
95.1
19.3
Graph shows rotational transition at bending residues and can be used
to identify hinge bending residues.
Probably only informative for interdomain rotations greater than 20 degrees
Residue
iResidue
i+1Distance of hinge axis to residue i in
(A) Distance of hinge axis to residue i in
(A) Change in
(deg) Change in
(deg) Angle of psi(i) axis to hinge axis
(deg) Angle of psi(i) axis to hinge axis
(deg) Percentage Progress
PRO-151
ALA-152
2.9
2.3
5.8
-1.3
90.3
95.1
19.3
PRO-151
ALA-152
2.9
2.3
5.8
-1.3
90.3
95.1
19.3
ALA-152
GLY-153
1.4
1.8
8.0
11.0
56.3
61.9
83.9
GLY-153
TYR-154
3.6
3.9
5.6
16.5
104.0
115.9
-45.8
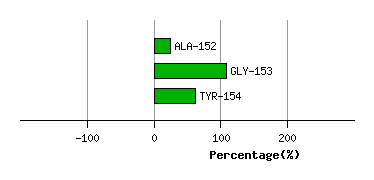
Graph shows rotational transition at bending residues and can be used
to identify hinge bending residues.
Probably only informative for interdomain rotations greater than 20 degrees
Residue
iResidue
i+1Distance of hinge axis to residue i in
(A) Distance of hinge axis to residue i in
(A) Change in
(deg) Change in
(deg) Angle of psi(i) axis to hinge axis
(deg) Angle of psi(i) axis to hinge axis
(deg) Percentage Progress
ASP-310
LEU-311
5.3
5.9
-0.7
-4.5
93.9
98.1
11.3
LEU-311
VAL-312
3.1
3.5
3.3
2.3
23.1
23.9
9.7
VAL-312
ASN-313
3.1
3.5
-5.6
7.3
112.4
112.1
-0.2
ASN-313
GLY-314
2.7
3.2
-3.7
1.3
114.0
113.0
-11.4
ASN-313
GLY-314
2.7
3.2
-3.7
1.3
114.0
113.0
-11.4
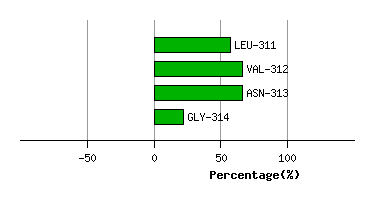
Graph shows rotational transition at bending residues and can be used
to identify hinge bending residues.
Probably only informative for interdomain rotations greater than 20 degrees
Residue
iResidue
i+1Distance of hinge axis to residue i in
(A) Distance of hinge axis to residue i in
(A) Change in
(deg) Change in
(deg) Angle of psi(i) axis to hinge axis
(deg) Angle of psi(i) axis to hinge axis
(deg) Percentage Progress
ASN-313
GLY-314
2.7
3.2
-3.7
1.3
114.0
113.0
-11.4
ASN-313
GLY-314
2.7
3.2
-3.7
1.3
114.0
113.0
-11.4
GLY-314
MET-315
2.1
2.0
-2.8
4.9
67.0
66.9
11.7
MET-315
TYR-316
2.7
2.2
4.3
-7.2
148.9
148.9
21.4
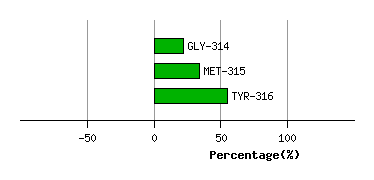
Graph shows rotational transition at bending residues and can be used
to identify hinge bending residues.
Probably only informative for interdomain rotations greater than 20 degrees