Vitamin D Hydroxylase
(All numbering and residues are taken from first PDB file)
![]()
![]()
Bending Residue Dihedral Analysis
Residue
iResidue
i+1Distance of hinge axis to residue i in
(A) Distance of hinge axis to residue i in
(A) Change in
(deg) Change in
(deg) Angle of psi(i) axis to hinge axis
(deg) Angle of psi(i) axis to hinge axis
(deg) Percentage Progress
PRO-146
VAL-147
5.1
4.5
-8.5
14.3
55.6
57.1
30.5
VAL-147
GLN-148
7.5
7.6
-7.7
-5.0
118.0
108.7
-1.5
GLN-148
VAL-149
8.2
8.2
-3.5
6.0
87.2
77.2
-10.2
VAL-149
ILE-150
5.0
5.4
-4.7
-2.0
24.6
15.5
42.5
ILE-150
CYS-151
5.5
5.6
7.3
-12.1
92.6
104.7
-12.5
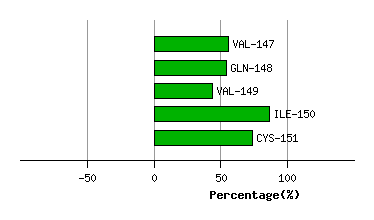
Graph shows rotational transition at bending residues and can be used
to identify hinge bending residues.
Probably only informative for interdomain rotations greater than 20 degrees
Residue
iResidue
i+1Distance of hinge axis to residue i in
(A) Distance of hinge axis to residue i in
(A) Change in
(deg) Change in
(deg) Angle of psi(i) axis to hinge axis
(deg) Angle of psi(i) axis to hinge axis
(deg) Percentage Progress
LEU-211
ALA-212
16.2
15.3
-28.8
23.4
97.0
108.3
8.4
ALA-212
VAL-213
18.6
18.2
-19.6
-2.1
125.6
129.9
-69.5
VAL-213
SER-214
16.8
16.5
-177.5
101.7
154.9
156.3
-465.5
SER-214
ASP-215
19.1
15.1
-149.5
14.2
91.8
120.6
223.3
ASP-215
GLU-216
20.1
18.8
150.4
-14.4
61.9
70.7
502.4
GLU-216
ASP-217
23.7
20.2
0.7
-84.2
20.4
39.5
-440.3
ASP-217
GLY-218
22.6
17.7
84.5
-148.0
94.3
81.4
-76.1
GLY-218
ASP-219
21.6
14.8
-16.2
-24.2
88.0
107.1
-36.8
ASP-219
ARG-220
17.8
13.7
-178.1
87.1
34.2
38.4
517.5
ARG-220
LEU-221
15.7
13.6
157.4
-85.5
75.6
111.9
-9.9
LEU-221
SER-222
12.5
11.2
-16.5
-19.4
115.3
120.4
-65.8
SER-222
GLN-223
12.8
10.8
0.7
-9.1
127.5
127.1
42.5
GLN-223
GLU-224
13.4
11.9
0.4
-1.8
90.0
98.8
-5.4
GLU-224
GLU-225
10.3
8.9
11.3
-7.2
122.4
124.0
-20.3
GLU-225
LEU-226
8.2
6.7
4.7
-2.2
169.7
162.0
3.6
LEU-226
VAL-227
9.9
9.0
3.6
0.4
112.1
113.1
-18.1
VAL-227
ALA-228
9.4
9.0
-2.9
-0.3
92.7
78.0
3.3
ALA-228
MET-229
5.9
5.4
4.5
-1.6
139.6
144.6
-20.7
MET-229
ALA-230
5.0
4.5
1.1
-2.9
150.4
146.0
17.7
ALA-230
MET-231
6.6
6.9
5.5
-3.1
94.3
100.0
-10.0
MET-231
LEU-232
6.1
6.5
-1.5
-0.8
81.8
67.8
3.7
LEU-232
LEU-233
2.4
3.0
-8.3
-2.6
14.1
10.4
70.3
LEU-233
LEU-234
2.0
2.7
3.1
-1.7
123.5
124.2
-12.4
LEU-234
ILE-235
4.9
6.1
0.7
7.1
82.0
99.5
-6.8
ILE-235
ALA-236
5.6
6.6
0.4
10.5
109.8
127.4
-37.6
ALA-236
GLY-237
3.9
4.1
-15.5
43.4
5.0
16.4
-121.5
GLY-237
HIS-238
3.1
4.2
-9.2
-17.7
51.5
67.1
71.3
HIS-238
GLU-239
6.2
7.8
53.9
-75.0
103.1
95.9
43.2
HIS-238
GLU-239
6.2
7.8
53.9
-75.0
103.1
95.9
43.2
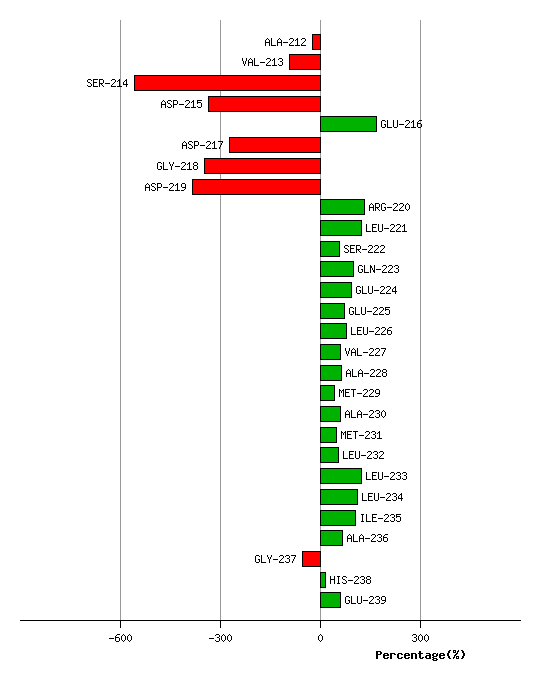
Graph shows rotational transition at bending residues and can be used
to identify hinge bending residues.
Probably only informative for interdomain rotations greater than 20 degrees
Residue
iResidue
i+1Distance of hinge axis to residue i in
(A) Distance of hinge axis to residue i in
(A) Change in
(deg) Change in
(deg) Angle of psi(i) axis to hinge axis
(deg) Angle of psi(i) axis to hinge axis
(deg) Percentage Progress
HIS-238
GLU-239
6.2
7.8
53.9
-75.0
103.1
95.9
43.2
HIS-238
GLU-239
6.2
7.8
53.9
-75.0
103.1
95.9
43.2
GLU-239
THR-240
9.3
9.0
46.9
-66.8
109.5
100.7
54.8
THR-240
THR-241
8.5
8.0
-19.1
11.3
11.8
12.4
20.3
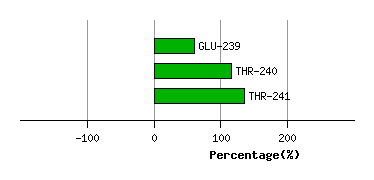
Graph shows rotational transition at bending residues and can be used
to identify hinge bending residues.
Probably only informative for interdomain rotations greater than 20 degrees