Aspartyl-Trna Synthetase
(All numbering and residues are taken from first PDB file)
![]()
![]()
Bending Residue Dihedral Analysis
Residue
iResidue
i+1Distance of hinge axis to residue i in
(A) Distance of hinge axis to residue i in
(A) Change in
(deg) Change in
(deg) Angle of psi(i) axis to hinge axis
(deg) Angle of psi(i) axis to hinge axis
(deg) Percentage Progress
PHE-280
PRO-281
7.9
7.7
2.6
7.1
22.8
26.9
149.0
PRO-281
ARG-282
7.6
7.3
5.4
-4.4
47.5
47.0
-142.6
ARG-282
VAL-283
6.6
6.4
6.3
-0.4
49.4
53.2
85.9
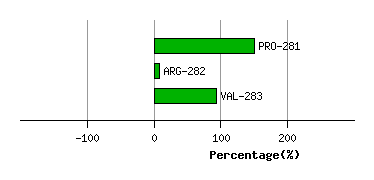
Graph shows rotational transition at bending residues and can be used
to identify hinge bending residues.
Probably only informative for interdomain rotations greater than 20 degrees
Residue
iResidue
i+1Distance of hinge axis to residue i in
(A) Distance of hinge axis to residue i in
(A) Change in
(deg) Change in
(deg) Angle of psi(i) axis to hinge axis
(deg) Angle of psi(i) axis to hinge axis
(deg) Percentage Progress
LEU-313
GLY-314
7.4
7.4
1.2
9.1
27.5
24.9
108.9
GLY-314
LYS-315
6.1
6.3
-7.6
4.5
121.7
116.8
-7.7
LYS-315
TYR-316
9.5
9.6
1.4
-2.2
109.5
112.1
-45.8
TYR-316
MET-317
10.1
10.0
6.4
-7.0
70.9
71.6
-38.1
MET-317
MET-318
7.4
7.4
9.2
-5.6
14.3
18.5
12.2
MET-318
GLU-319
7.8
8.3
4.8
13.3
79.5
89.5
95.7
GLU-319
ASN-320
11.6
12.1
-21.2
17.5
58.8
67.6
-30.8
ASN-320
GLU-321
12.4
12.4
3.0
-18.1
90.5
76.2
-29.8
GLU-321
ASN-322
10.4
10.5
3.7
-8.9
23.0
20.2
-48.9
ASN-322
ALA-323
9.6
9.3
5.0
11.0
89.2
91.1
-1.2
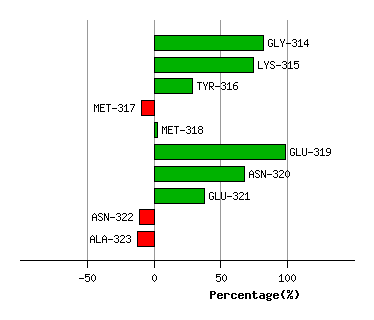
Graph shows rotational transition at bending residues and can be used
to identify hinge bending residues.
Probably only informative for interdomain rotations greater than 20 degrees
Residue
iResidue
i+1Distance of hinge axis to residue i in
(A) Distance of hinge axis to residue i in
(A) Change in
(deg) Change in
(deg) Angle of psi(i) axis to hinge axis
(deg) Angle of psi(i) axis to hinge axis
(deg) Percentage Progress
PRO-324
LEU-325
3.1
2.8
-11.5
5.6
122.0
127.8
-91.1
LEU-325
TYR-326
2.0
1.8
-0.4
3.5
145.3
147.3
24.7
TYR-326
PHE-327
3.0
2.7
0.7
-1.3
46.8
47.8
3.7
PHE-327
LEU-328
3.7
3.5
-9.4
17.7
146.5
144.8
0.3
LEU-328
TYR-329
2.0
1.9
10.4
-15.2
53.2
55.5
-65.4
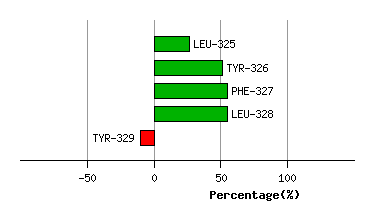
Graph shows rotational transition at bending residues and can be used
to identify hinge bending residues.
Probably only informative for interdomain rotations greater than 20 degrees
Residue
iResidue
i+1Distance of hinge axis to residue i in
(A) Distance of hinge axis to residue i in
(A) Change in
(deg) Change in
(deg) Angle of psi(i) axis to hinge axis
(deg) Angle of psi(i) axis to hinge axis
(deg) Percentage Progress
GLY-359
VAL-360
6.0
6.2
-8.4
6.8
102.2
103.9
15.4
VAL-360
GLU-361
7.3
7.5
3.8
2.3
77.1
75.7
-3.5
GLU-361
ILE-362
7.3
7.5
-1.7
8.4
47.7
44.8
-52.3
ILE-362
SER-363
8.6
8.6
-2.9
5.0
113.7
116.4
-10.8
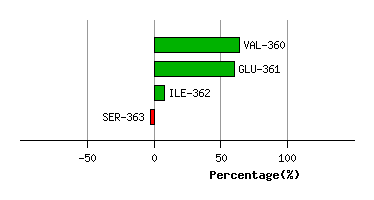
Graph shows rotational transition at bending residues and can be used
to identify hinge bending residues.
Probably only informative for interdomain rotations greater than 20 degrees