Succinyl-Coa:3-Ketoacid-Coenzyme A Transferase
(All numbering and residues are taken from first PDB file)
![]()
![]()
Bending Residue Dihedral Analysis
Residue
iResidue
i+1Distance of hinge axis to residue i in
(A) Distance of hinge axis to residue i in
(A) Change in
(deg) Change in
(deg) Angle of psi(i) axis to hinge axis
(deg) Angle of psi(i) axis to hinge axis
(deg) Percentage Progress
ALA-87
VAL-88
16.3
16.1
-4.8
5.2
113.9
113.1
-1.0
VAL-88
SER-89
14.3
14.2
1.1
-1.3
17.4
19.5
5.1
SER-89
ASN-90
13.5
13.5
-6.5
0.0
108.4
110.6
-9.3
ASN-90
ASN-91
10.4
10.5
-1.3
4.8
93.3
94.0
-16.4
ASN-90
ASN-91
10.4
10.5
-1.3
4.8
93.3
94.0
-16.4
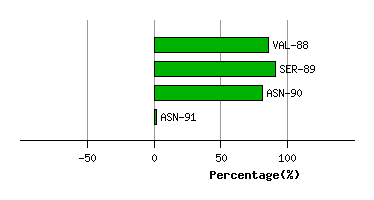
Graph shows rotational transition at bending residues and can be used
to identify hinge bending residues.
Probably only informative for interdomain rotations greater than 20 degrees
Residue
iResidue
i+1Distance of hinge axis to residue i in
(A) Distance of hinge axis to residue i in
(A) Change in
(deg) Change in
(deg) Angle of psi(i) axis to hinge axis
(deg) Angle of psi(i) axis to hinge axis
(deg) Percentage Progress
ASN-90
ASN-91
10.4
10.5
-1.3
4.8
93.3
94.0
-16.4
ASN-90
ASN-91
10.4
10.5
-1.3
4.8
93.3
94.0
-16.4
ASN-91
ALA-92
11.1
11.0
1.5
9.4
60.9
58.9
1.7
ALA-92
GLY-93
14.1
13.7
-5.2
-4.9
51.0
51.6
90.5
GLY-93
VAL-94
16.0
15.8
-5.9
-3.7
88.0
84.6
-51.5
VAL-94
ASP-95
17.7
17.4
-0.8
12.4
134.6
130.6
211.0
ASP-95
ASN-96
20.3
20.0
-8.2
-13.5
87.2
95.5
116.6
ASN-96
PHE-97
23.1
22.8
32.7
-6.8
119.9
130.3
-258.6
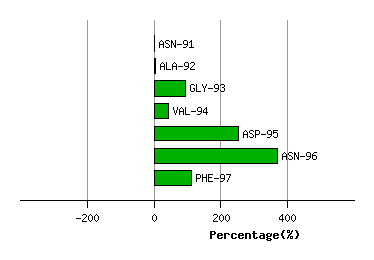
Graph shows rotational transition at bending residues and can be used
to identify hinge bending residues.
Probably only informative for interdomain rotations greater than 20 degrees
Residue
iResidue
i+1Distance of hinge axis to residue i in
(A) Distance of hinge axis to residue i in
(A) Change in
(deg) Change in
(deg) Angle of psi(i) axis to hinge axis
(deg) Angle of psi(i) axis to hinge axis
(deg) Percentage Progress
GLU-132
VAL-133
10.8
10.7
-2.7
12.3
155.6
157.7
299.0
VAL-133
GLU-134
8.6
8.6
-9.9
5.0
90.0
87.9
-317.6
GLU-134
LEU-135
6.2
6.2
0.5
7.8
16.8
16.6
184.7
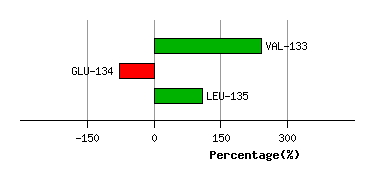
Graph shows rotational transition at bending residues and can be used
to identify hinge bending residues.
Probably only informative for interdomain rotations greater than 20 degrees
Residue
iResidue
i+1Distance of hinge axis to residue i in
(A) Distance of hinge axis to residue i in
(A) Change in
(deg) Change in
(deg) Angle of psi(i) axis to hinge axis
(deg) Angle of psi(i) axis to hinge axis
(deg) Percentage Progress
PRO-137
GLN-138
4.7
4.7
-0.4
-0.7
58.0
56.7
-52.6
GLN-138
GLY-139
6.3
6.4
3.2
-2.0
101.6
100.9
-31.9
GLY-139
THR-140
8.7
8.9
-3.6
5.5
143.7
146.4
55.5
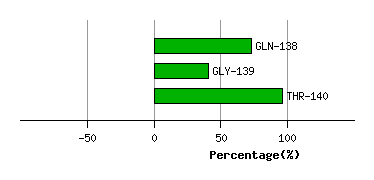
Graph shows rotational transition at bending residues and can be used
to identify hinge bending residues.
Probably only informative for interdomain rotations greater than 20 degrees
Residue
iResidue
i+1Distance of hinge axis to residue i in
(A) Distance of hinge axis to residue i in
(A) Change in
(deg) Change in
(deg) Angle of psi(i) axis to hinge axis
(deg) Angle of psi(i) axis to hinge axis
(deg) Percentage Progress
THR-159
GLY-160
9.7
9.7
-1.9
0.5
22.5
22.3
61.7
GLY-160
TYR-161
8.0
7.9
-7.4
4.8
53.7
54.2
-44.8
TYR-161
GLY-162
11.3
11.3
1.0
7.9
95.4
90.3
25.2
GLY-162
THR-163
11.8
11.5
-13.4
5.4
95.0
91.4
140.8
THR-163
LEU-164
8.2
8.0
10.9
-0.3
146.6
147.1
-189.5
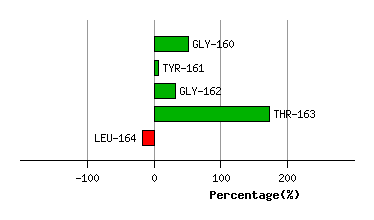
Graph shows rotational transition at bending residues and can be used
to identify hinge bending residues.
Probably only informative for interdomain rotations greater than 20 degrees
Residue
iResidue
i+1Distance of hinge axis to residue i in
(A) Distance of hinge axis to residue i in
(A) Change in
(deg) Change in
(deg) Angle of psi(i) axis to hinge axis
(deg) Angle of psi(i) axis to hinge axis
(deg) Percentage Progress
ILE-279
GLU-280
18.1
18.3
-16.3
14.8
48.7
56.5
-49.9
GLU-280
ARG-281
16.4
16.7
4.9
-3.0
59.6
61.4
82.6
ARG-281
LEU-282
15.0
15.2
10.7
-14.3
12.6
13.8
-80.3
ASN-300
VAL-301
21.8
13.5
-33.6
-62.8
59.8
157.8
2644.9
VAL-301
ARG-302
21.2
14.0
-172.2
-37.6
91.7
127.8
-5203.3
GLU-303
ARG-304
17.3
17.2
9.8
-10.0
83.7
84.1
-38.0
ARG-304
ILE-305
18.8
18.8
6.7
-4.2
113.5
117.7
29.3
ILE-305
ILE-306
16.4
16.5
-5.1
5.6
120.2
122.1
-7.6
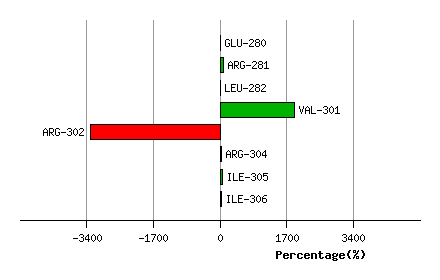
Graph shows rotational transition at bending residues and can be used
to identify hinge bending residues.
Probably only informative for interdomain rotations greater than 20 degrees
Residue
iResidue
i+1Distance of hinge axis to residue i in
(A) Distance of hinge axis to residue i in
(A) Change in
(deg) Change in
(deg) Angle of psi(i) axis to hinge axis
(deg) Angle of psi(i) axis to hinge axis
(deg) Percentage Progress
GLU-312
PHE-313
13.2
13.2
-12.7
8.7
70.5
66.3
113.2
PHE-313
GLU-314
11.1
10.8
-13.0
11.4
51.2
49.3
8.5
GLU-314
ASP-315
12.8
12.5
6.2
-6.7
115.7
114.9
-16.1
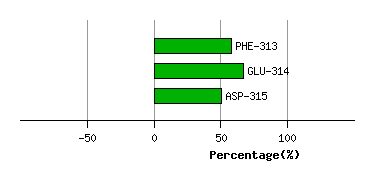
Graph shows rotational transition at bending residues and can be used
to identify hinge bending residues.
Probably only informative for interdomain rotations greater than 20 degrees
Residue
iResidue
i+1Distance of hinge axis to residue i in
(A) Distance of hinge axis to residue i in
(A) Change in
(deg) Change in
(deg) Angle of psi(i) axis to hinge axis
(deg) Angle of psi(i) axis to hinge axis
(deg) Percentage Progress
PRO-326
LEU-327
7.7
7.6
14.0
-8.6
40.8
44.9
115.9
LEU-327
LEU-328
5.4
5.4
3.3
-1.9
33.7
37.9
27.7
LEU-328
ALA-329
8.4
8.5
-2.5
3.0
125.7
125.0
3.5
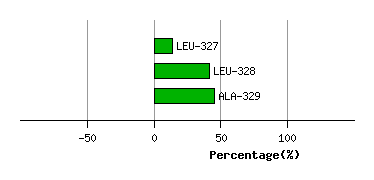
Graph shows rotational transition at bending residues and can be used
to identify hinge bending residues.
Probably only informative for interdomain rotations greater than 20 degrees
Residue
iResidue
i+1Distance of hinge axis to residue i in
(A) Distance of hinge axis to residue i in
(A) Change in
(deg) Change in
(deg) Angle of psi(i) axis to hinge axis
(deg) Angle of psi(i) axis to hinge axis
(deg) Percentage Progress
PHE-332
ILE-333
9.1
8.8
-22.2
29.4
78.7
73.6
65.5
ILE-333
SER-334
7.4
7.0
14.0
-11.4
168.5
174.2
-82.2
SER-334
PRO-335
8.4
8.0
7.3
-4.1
106.3
109.1
50.6
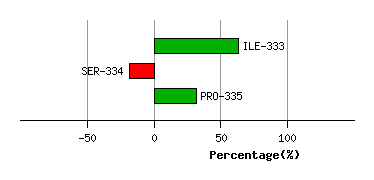
Graph shows rotational transition at bending residues and can be used
to identify hinge bending residues.
Probably only informative for interdomain rotations greater than 20 degrees
Residue
iResidue
i+1Distance of hinge axis to residue i in
(A) Distance of hinge axis to residue i in
(A) Change in
(deg) Change in
(deg) Angle of psi(i) axis to hinge axis
(deg) Angle of psi(i) axis to hinge axis
(deg) Percentage Progress
ASN-336
MET-337
8.3
8.0
15.4
-20.7
146.2
144.8
119.8
MET-337
THR-338
9.1
8.6
-4.4
2.0
63.8
63.7
119.0
THR-338
VAL-339
8.2
7.7
0.8
1.6
173.4
169.3
-96.0
VAL-339
HIS-340
7.2
6.9
2.8
-2.4
113.7
112.9
-22.6
HIS-340
LEU-341
7.0
6.8
8.1
-6.8
153.5
154.2
-24.2
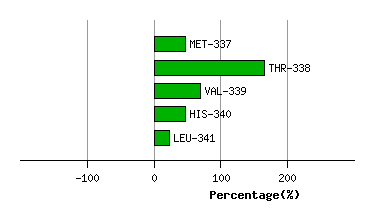
Graph shows rotational transition at bending residues and can be used
to identify hinge bending residues.
Probably only informative for interdomain rotations greater than 20 degrees
Residue
iResidue
i+1Distance of hinge axis to residue i in
(A) Distance of hinge axis to residue i in
(A) Change in
(deg) Change in
(deg) Angle of psi(i) axis to hinge axis
(deg) Angle of psi(i) axis to hinge axis
(deg) Percentage Progress
GLY-391
GLY-392
15.8
15.8
4.1
2.5
52.1
48.9
51.5
GLY-392
HIS-393
14.8
14.7
-7.5
9.9
167.8
167.1
68.5
HIS-393
VAL-394
14.6
14.4
-6.1
8.2
119.9
123.8
24.8
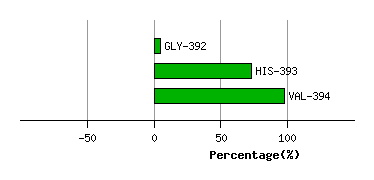
Graph shows rotational transition at bending residues and can be used
to identify hinge bending residues.
Probably only informative for interdomain rotations greater than 20 degrees
Residue
iResidue
i+1Distance of hinge axis to residue i in
(A) Distance of hinge axis to residue i in
(A) Change in
(deg) Change in
(deg) Angle of psi(i) axis to hinge axis
(deg) Angle of psi(i) axis to hinge axis
(deg) Percentage Progress
GLY-422
MET-423
4.3
4.0
-2.5
3.7
44.7
43.1
-16.3
MET-423
GLY-424
1.4
1.2
1.0
3.2
146.7
147.8
-85.7
GLY-424
GLY-425
2.5
2.4
-0.3
1.6
78.6
80.6
43.8
GLY-425
ALA-426
2.8
3.0
4.2
-5.9
92.7
91.3
-39.4
ALA-426
MET-427
3.1
3.1
4.3
-0.8
63.4
62.6
77.2
MET-427
ASP-428
5.5
5.5
0.2
-2.0
115.9
116.9
32.6
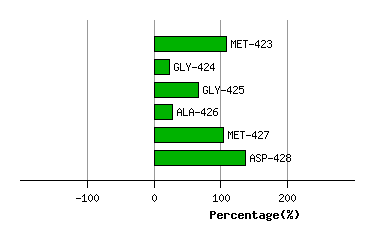
Graph shows rotational transition at bending residues and can be used
to identify hinge bending residues.
Probably only informative for interdomain rotations greater than 20 degrees
Residue
iResidue
i+1Distance of hinge axis to residue i in
(A) Distance of hinge axis to residue i in
(A) Change in
(deg) Change in
(deg) Angle of psi(i) axis to hinge axis
(deg) Angle of psi(i) axis to hinge axis
(deg) Percentage Progress
LYS-434
THR-435
17.1
17.1
-20.4
15.0
122.8
124.6
-88.7
THR-435
LYS-436
13.8
13.8
2.1
4.3
96.6
94.7
17.1
LYS-436
VAL-437
14.2
14.1
-2.1
-0.1
75.5
71.6
16.0
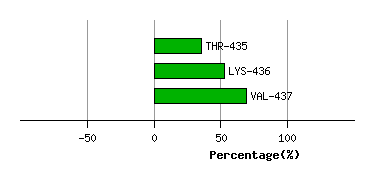
Graph shows rotational transition at bending residues and can be used
to identify hinge bending residues.
Probably only informative for interdomain rotations greater than 20 degrees
Residue
iResidue
i+1Distance of hinge axis to residue i in
(A) Distance of hinge axis to residue i in
(A) Change in
(deg) Change in
(deg) Angle of psi(i) axis to hinge axis
(deg) Angle of psi(i) axis to hinge axis
(deg) Percentage Progress
LYS-463
GLN-464
13.9
13.9
11.9
-10.0
138.9
137.1
-73.5
GLN-464
CYS-465
16.5
16.7
-3.8
-18.1
40.5
41.7
367.3
CYS-465
VAL-466
14.0
14.3
23.4
-17.6
148.9
148.6
-207.4
VAL-466
ASN-467
14.8
14.7
5.6
-1.5
116.2
119.3
-120.8
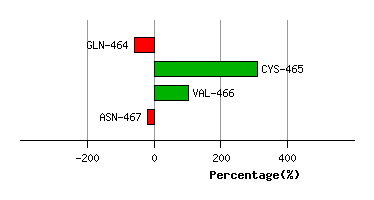
Graph shows rotational transition at bending residues and can be used
to identify hinge bending residues.
Probably only informative for interdomain rotations greater than 20 degrees