Phosphoenolpyruvate Carboxykinase, Cytosolic [Gtp]
(All numbering and residues are taken from first PDB file)
![]()
![]()
Bending Residue Dihedral Analysis
Residue
iResidue
i+1Distance of hinge axis to residue i in
(A) Distance of hinge axis to residue i in
(A) Change in
(deg) Change in
(deg) Angle of psi(i) axis to hinge axis
(deg) Angle of psi(i) axis to hinge axis
(deg) Percentage Progress
LEU-280
ALA-281
8.0
8.2
-1.0
2.4
122.5
123.3
-17.7
ALA-281
ALA-282
8.2
8.4
3.0
-4.1
48.9
50.0
5.5
ALA-282
ALA-283
5.4
5.6
-4.6
5.0
134.8
134.5
-1.0
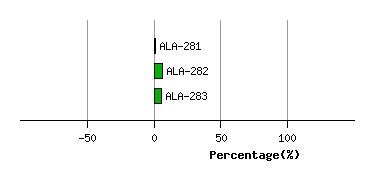
Graph shows rotational transition at bending residues and can be used
to identify hinge bending residues.
Probably only informative for interdomain rotations greater than 20 degrees
Residue
iResidue
i+1Distance of hinge axis to residue i in
(A) Distance of hinge axis to residue i in
(A) Change in
(deg) Change in
(deg) Angle of psi(i) axis to hinge axis
(deg) Angle of psi(i) axis to hinge axis
(deg) Percentage Progress
GLY-289
LYS-290
7.8
7.1
-36.9
7.7
112.3
125.1
-111.8
LYS-290
THR-291
6.9
7.0
-4.9
10.1
153.6
154.7
39.5
THR-291
ASN-292
9.4
9.6
-7.7
-4.2
135.1
130.7
-64.0
ASN-292
LEU-293
8.3
8.2
2.9
-1.1
68.6
67.5
20.2
LEU-293
ALA-294
4.5
4.5
-0.3
-2.7
125.1
130.1
-22.0
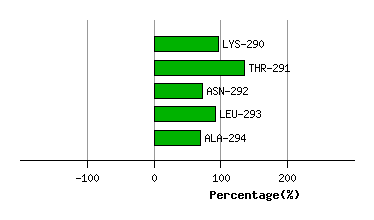
Graph shows rotational transition at bending residues and can be used
to identify hinge bending residues.
Probably only informative for interdomain rotations greater than 20 degrees
Residue
iResidue
i+1Distance of hinge axis to residue i in
(A) Distance of hinge axis to residue i in
(A) Change in
(deg) Change in
(deg) Angle of psi(i) axis to hinge axis
(deg) Angle of psi(i) axis to hinge axis
(deg) Percentage Progress
ALA-458
ALA-459
7.4
7.5
-2.6
0.9
115.1
115.3
-8.0
ALA-459
MET-460
5.0
5.0
-2.7
1.3
64.8
66.2
-8.3
MET-460
ARG-461
2.1
2.1
3.3
2.3
54.5
53.5
24.6
ARG-461
SER-462
1.5
1.4
-8.1
-1.7
47.4
46.4
35.8
SER-462
GLU-463
4.8
4.7
4.2
16.1
61.2
64.7
71.6
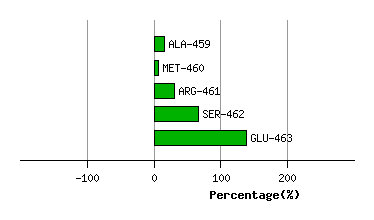
Graph shows rotational transition at bending residues and can be used
to identify hinge bending residues.
Probably only informative for interdomain rotations greater than 20 degrees
Residue
iResidue
i+1Distance of hinge axis to residue i in
(A) Distance of hinge axis to residue i in
(A) Change in
(deg) Change in
(deg) Angle of psi(i) axis to hinge axis
(deg) Angle of psi(i) axis to hinge axis
(deg) Percentage Progress
ILE-475
MET-476
7.0
7.2
14.3
-15.4
111.9
121.2
-3.9
MET-476
HIS-477
5.2
5.4
-12.4
26.5
113.1
111.1
49.2
HIS-477
ASP-478
2.8
3.1
-2.2
0.3
124.0
126.2
-4.3
ASP-478
PRO-479
4.9
5.1
0.6
-9.1
63.2
62.8
-35.1
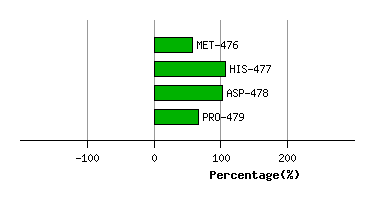
Graph shows rotational transition at bending residues and can be used
to identify hinge bending residues.
Probably only informative for interdomain rotations greater than 20 degrees