Camp-Dependent Protein Kinase, Alpha-Catalytic Subunit
(All numbering and residues are taken from first PDB file)
![]()
![]()
Bending Residue Dihedral Analysis
Residue
iResidue
i+1Distance of hinge axis to residue i in
(A) Distance of hinge axis to residue i in
(A) Change in
(deg) Change in
(deg) Angle of psi(i) axis to hinge axis
(deg) Angle of psi(i) axis to hinge axis
(deg) Percentage Progress
THR-32
PRO-33
7.1
5.9
0.3
0.8
158.4
150.0
-9.2
PRO-33
SER-34
5.4
4.2
3.9
-0.4
106.6
105.2
26.9
SER-34
GLN-35
7.9
6.9
19.5
-27.3
92.1
78.6
41.3
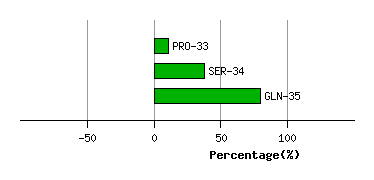
Graph shows rotational transition at bending residues and can be used
to identify hinge bending residues.
Probably only informative for interdomain rotations greater than 20 degrees
Residue
iResidue
i+1Distance of hinge axis to residue i in
(A) Distance of hinge axis to residue i in
(A) Change in
(deg) Change in
(deg) Angle of psi(i) axis to hinge axis
(deg) Angle of psi(i) axis to hinge axis
(deg) Percentage Progress
GLU-91
LYS-92
6.4
7.3
-22.5
9.6
103.6
101.6
-40.7
LYS-92
ARG-93
4.4
5.1
-11.1
5.6
64.5
68.4
1.0
ARG-93
ILE-94
1.6
2.3
-1.8
-5.5
121.0
120.8
1.5
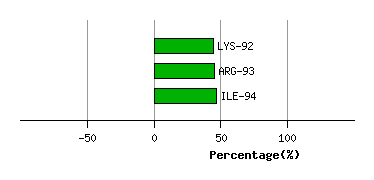
Graph shows rotational transition at bending residues and can be used
to identify hinge bending residues.
Probably only informative for interdomain rotations greater than 20 degrees
Residue
iResidue
i+1Distance of hinge axis to residue i in
(A) Distance of hinge axis to residue i in
(A) Change in
(deg) Change in
(deg) Angle of psi(i) axis to hinge axis
(deg) Angle of psi(i) axis to hinge axis
(deg) Percentage Progress
VAL-104
LYS-105
2.3
2.8
0.3
-0.6
50.2
47.5
-7.1
LYS-105
LEU-106
1.4
0.7
-2.8
7.5
113.2
112.5
29.2
LEU-106
GLU-107
3.2
3.0
18.9
-17.3
88.8
89.3
22.3
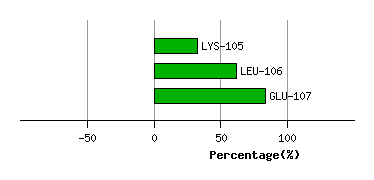
Graph shows rotational transition at bending residues and can be used
to identify hinge bending residues.
Probably only informative for interdomain rotations greater than 20 degrees
Residue
iResidue
i+1Distance of hinge axis to residue i in
(A) Distance of hinge axis to residue i in
(A) Change in
(deg) Change in
(deg) Angle of psi(i) axis to hinge axis
(deg) Angle of psi(i) axis to hinge axis
(deg) Percentage Progress
TYR-122
VAL-123
5.2
5.9
-9.1
23.5
133.6
128.3
47.8
VAL-123
ALA-124
4.1
4.7
-36.3
17.4
125.5
134.8
-27.1
ALA-124
GLY-125
6.3
6.4
14.1
-32.8
75.7
55.1
-8.0
GLY-125
GLY-126
7.0
7.0
56.7
-32.0
97.6
99.4
10.1
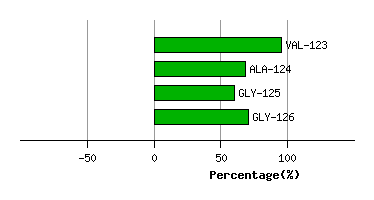
Graph shows rotational transition at bending residues and can be used
to identify hinge bending residues.
Probably only informative for interdomain rotations greater than 20 degrees
Residue
iResidue
i+1Distance of hinge axis to residue i in
(A) Distance of hinge axis to residue i in
(A) Change in
(deg) Change in
(deg) Angle of psi(i) axis to hinge axis
(deg) Angle of psi(i) axis to hinge axis
(deg) Percentage Progress
ILE-315
PRO-316
6.7
6.9
-10.0
11.5
78.1
80.0
10.5
PRO-316
LYS-317
7.3
6.8
7.0
-34.7
113.8
124.1
83.2
LYS-317
PHE-318
6.7
6.3
-5.1
-61.0
129.1
123.8
-179.3
ASP-329
TYR-330
24.9
20.3
95.1
-27.4
30.0
33.1
308.2
TYR-330
GLU-331
23.7
21.8
37.0
-0.4
43.1
79.3
51.8
GLU-331
GLU-332
25.2
24.9
-66.4
65.6
142.4
126.8
0.2
GLU-332
GLU-333
25.4
24.0
-24.9
28.2
148.0
140.6
21.9
GLU-333
GLU-334
24.9
25.2
-15.7
28.3
136.9
110.4
42.0
GLU-334
ILE-335
25.8
25.9
-39.2
57.9
126.4
147.3
65.5
ILE-335
ARG-336
23.7
23.3
3.5
-14.6
28.4
48.4
-57.1
ARG-336
VAL-337
25.3
25.6
52.1
-18.8
42.8
34.0
136.2
ILE-339
ASN-340
28.0
28.0
34.3
1.5
32.7
25.5
138.7
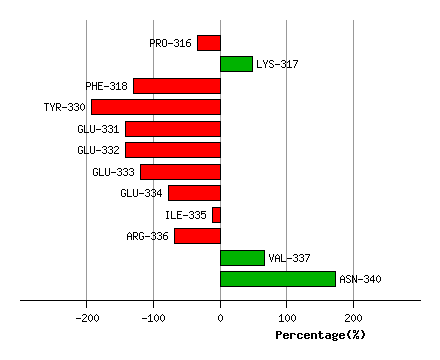
Graph shows rotational transition at bending residues and can be used
to identify hinge bending residues.
Probably only informative for interdomain rotations greater than 20 degrees