Beta-Actin
(All numbering and residues are taken from first PDB file)
![]()
![]()
Bending Residue Dihedral Analysis
Residue
iResidue
i+1Distance of hinge axis to residue i in
(A) Distance of hinge axis to residue i in
(A) Change in
(deg) Change in
(deg) Angle of psi(i) axis to hinge axis
(deg) Angle of psi(i) axis to hinge axis
(deg) Percentage Progress
TYR-143
ALA-144
7.7
8.0
-6.1
3.7
97.3
97.6
-32.6
ALA-144
SER-145
7.2
7.6
-7.9
5.9
155.6
153.8
16.0
SER-145
GLY-146
8.0
8.4
14.7
-14.0
85.5
84.5
6.9
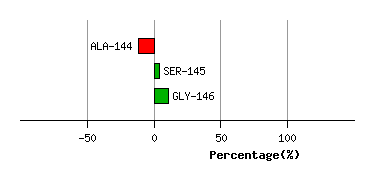
Graph shows rotational transition at bending residues and can be used
to identify hinge bending residues.
Probably only informative for interdomain rotations greater than 20 degrees
Residue
iResidue
i+1Distance of hinge axis to residue i in
(A) Distance of hinge axis to residue i in
(A) Change in
(deg) Change in
(deg) Angle of psi(i) axis to hinge axis
(deg) Angle of psi(i) axis to hinge axis
(deg) Percentage Progress
PRO-164
ILE-165
10.2
10.4
-2.3
6.1
143.1
144.8
39.7
ILE-165
TYR-166
10.9
11.1
8.9
-9.1
107.7
108.8
-1.2
TYR-166
GLU-167
14.1
14.3
6.0
2.7
35.3
40.1
85.3
GLU-167
GLY-168
14.9
15.7
-13.1
19.9
30.2
24.8
-104.1
GLU-167
GLY-168
14.9
15.7
-13.1
19.9
30.2
24.8
-104.1
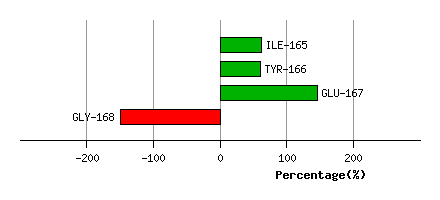
Graph shows rotational transition at bending residues and can be used
to identify hinge bending residues.
Probably only informative for interdomain rotations greater than 20 degrees
Residue
iResidue
i+1Distance of hinge axis to residue i in
(A) Distance of hinge axis to residue i in
(A) Change in
(deg) Change in
(deg) Angle of psi(i) axis to hinge axis
(deg) Angle of psi(i) axis to hinge axis
(deg) Percentage Progress
GLU-167
GLY-168
14.9
15.7
-13.1
19.9
30.2
24.8
-104.1
GLU-167
GLY-168
14.9
15.7
-13.1
19.9
30.2
24.8
-104.1
GLY-168
TYR-169
12.2
13.0
1.7
-31.0
101.9
110.1
91.4
TYR-169
ALA-170
13.4
12.9
24.2
10.4
49.0
45.3
281.7
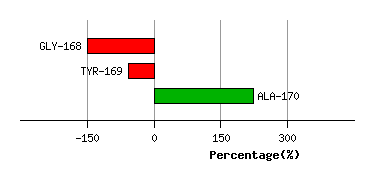
Graph shows rotational transition at bending residues and can be used
to identify hinge bending residues.
Probably only informative for interdomain rotations greater than 20 degrees
Residue
iResidue
i+1Distance of hinge axis to residue i in
(A) Distance of hinge axis to residue i in
(A) Change in
(deg) Change in
(deg) Angle of psi(i) axis to hinge axis
(deg) Angle of psi(i) axis to hinge axis
(deg) Percentage Progress
GLY-342
GLY-343
5.5
5.8
-5.5
3.3
165.7
168.7
2.8
GLY-343
SER-344
4.2
4.4
2.3
-2.3
60.7
58.4
-27.5
SER-344
ILE-345
7.5
7.7
-0.8
-3.5
83.3
85.2
30.9
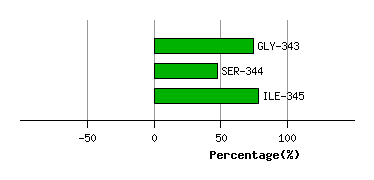
Graph shows rotational transition at bending residues and can be used
to identify hinge bending residues.
Probably only informative for interdomain rotations greater than 20 degrees