Colicin E3
(All numbering and residues are taken from first PDB file)
![]()
![]()
Bending Residue Dihedral Analysis
Residue
iResidue
i+1Distance of hinge axis to residue i in
(A) Distance of hinge axis to residue i in
(A) Change in
(deg) Change in
(deg) Angle of psi(i) axis to hinge axis
(deg) Angle of psi(i) axis to hinge axis
(deg) Percentage Progress
THR-157
SER-158
3.7
11.6
116.2
-3.5
45.3
120.1
59.2
SER-158
LEU-159
3.7
10.8
159.2
-67.2
80.7
134.0
101.2
LEU-159
PRO-160
7.3
8.0
29.7
-7.7
115.7
120.4
-34.8
PRO-160
ALA-161
9.1
7.9
139.5
145.3
141.4
61.4
-74.2
ALA-161
ASP-162
11.0
8.2
-164.2
64.7
102.2
65.9
126.1
ASP-162
ASP-163
12.2
6.9
176.1
95.1
136.9
80.5
75.6
ASP-163
ILE-164
15.3
3.3
172.9
-26.7
57.7
25.1
-203.7
ILE-164
THR-165
18.2
4.0
-110.5
-12.6
119.8
98.8
77.9
THR-165
GLU-166
19.5
7.4
-30.6
-4.0
115.1
64.6
30.4
GLU-166
SER-167
22.8
8.9
-161.6
-84.4
143.7
37.7
-20.8
SER-167
PRO-168
23.2
11.2
168.3
4.9
29.1
106.2
-188.7
PRO-168
VAL-169
23.9
11.1
157.3
33.2
65.0
59.2
244.4
VAL-169
SER-170
20.1
13.0
-154.9
46.6
101.6
60.6
-169.9
SER-170
SER-171
18.2
15.5
-40.8
53.3
97.6
94.9
-13.7
SER-171
LEU-172
15.0
16.6
-78.4
-6.2
42.8
165.2
84.5
LEU-172
PRO-173
12.9
17.7
-13.0
19.5
97.5
99.0
11.9
PRO-173
LEU-174
10.3
21.3
-42.9
108.4
56.7
111.9
27.8
LEU-174
ASP-175
6.7
22.2
-151.5
-24.0
102.8
165.7
-176.4
ASP-175
LYS-176
5.0
23.3
25.0
70.6
64.2
52.0
42.4
LYS-176
ALA-177
1.5
19.9
-6.9
25.1
115.1
120.7
15.5
ALA-177
THR-178
2.3
18.4
-143.5
-68.5
94.6
93.1
39.1
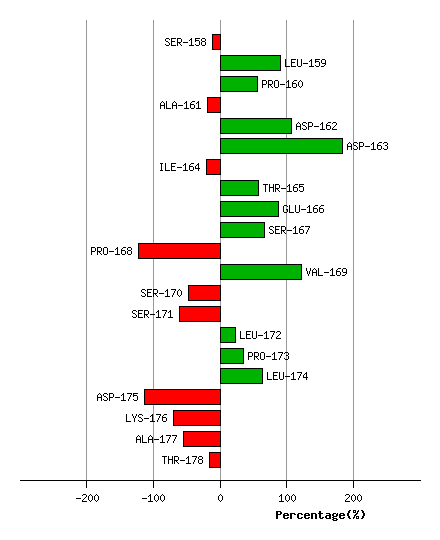
Graph shows rotational transition at bending residues and can be used
to identify hinge bending residues.
Probably only informative for interdomain rotations greater than 20 degrees
Residue
iResidue
i+1Distance of hinge axis to residue i in
(A) Distance of hinge axis to residue i in
(A) Change in
(deg) Change in
(deg) Angle of psi(i) axis to hinge axis
(deg) Angle of psi(i) axis to hinge axis
(deg) Percentage Progress
ARG-184
VAL-185
11.8
2.1
-96.6
-45.2
51.1
79.3
-132.7
VAL-185
VAL-186
15.3
4.6
175.6
30.4
133.3
164.3
157.9
VAL-186
ASP-187
15.7
4.9
140.4
54.1
74.5
114.4
-100.8
ASP-187
ASP-188
15.0
7.3
-39.4
-58.9
118.1
52.3
-84.1
ASP-188
VAL-189
12.9
7.3
40.7
-34.3
12.3
116.3
-6.0
VAL-189
LYS-190
11.7
9.9
37.1
-71.5
63.7
95.2
-40.9
LYS-190
ASP-191
12.1
12.3
-58.2
58.8
129.8
52.3
3.3
ASP-191
GLU-192
9.2
15.7
-81.4
-137.6
95.5
68.9
-22.8
GLU-192
ARG-193
7.4
15.6
-134.0
-60.2
119.8
133.8
193.4
ARG-193
GLN-194
5.3
15.1
59.0
-2.3
113.2
64.4
3.2
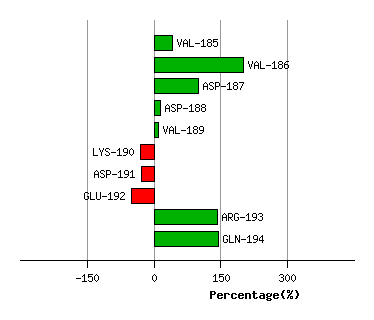
Graph shows rotational transition at bending residues and can be used
to identify hinge bending residues.
Probably only informative for interdomain rotations greater than 20 degrees
Residue
iResidue
i+1Distance of hinge axis to residue i in
(A) Distance of hinge axis to residue i in
(A) Change in
(deg) Change in
(deg) Angle of psi(i) axis to hinge axis
(deg) Angle of psi(i) axis to hinge axis
(deg) Percentage Progress
PRO-203
MET-204
13.5
9.8
-22.6
-12.5
155.8
61.7
-1.1
MET-204
SER-205
15.6
7.7
54.1
-39.8
101.7
65.7
-0.9
SER-205
VAL-206
18.1
9.5
19.6
-39.0
24.3
97.9
-16.9
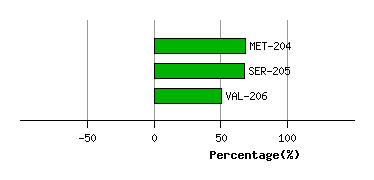
Graph shows rotational transition at bending residues and can be used
to identify hinge bending residues.
Probably only informative for interdomain rotations greater than 20 degrees
Residue
iResidue
i+1Distance of hinge axis to residue i in
(A) Distance of hinge axis to residue i in
(A) Change in
(deg) Change in
(deg) Angle of psi(i) axis to hinge axis
(deg) Angle of psi(i) axis to hinge axis
(deg) Percentage Progress
PHE-260
GLY-261
2.1
6.3
-128.0
67.8
79.1
114.6
52.0
GLY-261
THR-262
5.2
4.5
-48.5
-52.7
153.8
88.2
-54.2
THR-262
GLN-263
5.7
2.4
-107.1
-109.1
88.6
28.0
-95.9
GLN-263
GLY-264
9.4
2.7
132.3
-141.2
155.0
100.2
0.6
GLY-264
GLY-265
9.7
3.9
122.6
-54.6
132.7
33.4
19.3
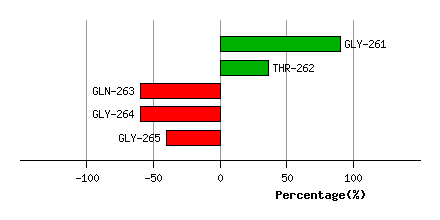
Graph shows rotational transition at bending residues and can be used
to identify hinge bending residues.
Probably only informative for interdomain rotations greater than 20 degrees