Preprotein Translocase Seca Subunit
(All numbering and residues are taken from first PDB file)
![]()
![]()
Bending Residue Dihedral Analysis
Residue
iResidue
i+1Distance of hinge axis to residue i in
(A) Distance of hinge axis to residue i in
(A) Change in
(deg) Change in
(deg) Angle of psi(i) axis to hinge axis
(deg) Angle of psi(i) axis to hinge axis
(deg) Percentage Progress
ILE-223
SER-224
3.4
1.2
-6.9
53.6
162.5
153.4
55.2
SER-224
GLY-225
2.5
1.3
3.0
117.5
64.2
82.3
23.2
GLY-225
GLN-226
2.0
4.0
43.9
20.7
72.2
47.1
95.9
GLN-226
ALA-227
2.1
6.4
-141.3
52.4
110.4
157.9
-63.7
ALA-227
ALA-228
5.8
5.7
100.3
0.2
62.9
65.4
55.1
ALA-228
LYS-229
7.3
3.1
119.3
-103.9
41.3
83.9
24.4
LYS-229
SER-230
8.6
2.8
87.5
-1.5
38.9
12.5
-332.1
SER-230
THR-231
6.0
4.8
-121.4
-67.0
167.1
116.8
181.8
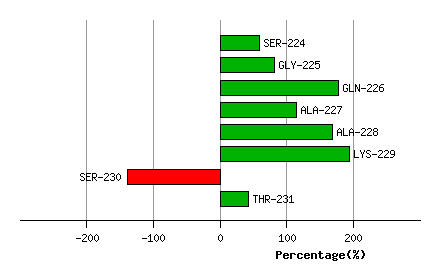
Graph shows rotational transition at bending residues and can be used
to identify hinge bending residues.
Probably only informative for interdomain rotations greater than 20 degrees
Residue
iResidue
i+1Distance of hinge axis to residue i in
(A) Distance of hinge axis to residue i in
(A) Change in
(deg) Change in
(deg) Angle of psi(i) axis to hinge axis
(deg) Angle of psi(i) axis to hinge axis
(deg) Percentage Progress
THR-243
LEU-244
21.6
18.1
-61.6
15.7
155.4
102.0
-27.2
LEU-244
LYS-245
22.4
21.0
94.6
-14.1
98.7
128.5
-62.8
LYS-245
ALA-246
26.1
23.8
-150.0
7.4
142.4
123.9
297.1
ALA-246
GLU-247
27.4
25.5
-11.5
-1.4
159.1
115.5
-5.7
GLU-247
LYS-248
25.2
29.0
-14.5
-2.6
96.9
101.2
-3.0
LYS-248
ASP-249
25.0
29.0
-129.0
-42.7
128.5
150.5
-198.9
ASP-249
TYR-250
26.7
26.5
173.0
-90.6
89.4
36.3
90.1
TYR-250
THR-251
29.5
26.6
0.7
-67.0
75.1
88.4
-8.4
THR-251
TYR-252
29.4
28.9
-23.5
49.2
163.6
135.3
27.9
TYR-252
ASP-253
29.8
29.0
-84.2
49.8
76.5
54.4
15.4
TYR-252
ASP-253
29.8
29.0
-84.2
49.8
76.5
54.4
15.4
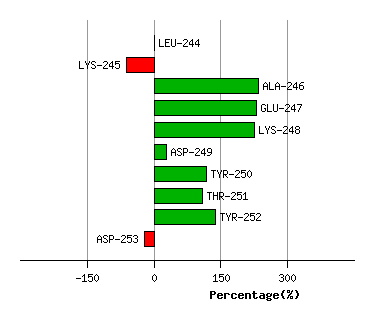
Graph shows rotational transition at bending residues and can be used
to identify hinge bending residues.
Probably only informative for interdomain rotations greater than 20 degrees
Residue
iResidue
i+1Distance of hinge axis to residue i in
(A) Distance of hinge axis to residue i in
(A) Change in
(deg) Change in
(deg) Angle of psi(i) axis to hinge axis
(deg) Angle of psi(i) axis to hinge axis
(deg) Percentage Progress
TYR-252
ASP-253
29.8
29.0
-84.2
49.8
76.5
54.4
15.4
TYR-252
ASP-253
29.8
29.0
-84.2
49.8
76.5
54.4
15.4
ASP-253
ILE-254
31.0
31.0
-46.9
-115.8
52.6
60.2
118.4
ILE-254
LYS-255
30.1
33.5
98.2
5.4
70.3
175.3
-97.6
LYS-255
THR-256
26.6
33.8
-6.3
85.5
119.8
60.7
-6.0
THR-256
LYS-257
24.8
30.0
-152.1
-119.0
75.0
105.4
-89.0
LYS-257
ALA-258
25.1
29.1
-53.6
-43.1
148.6
108.0
216.4
ALA-258
VAL-259
24.3
26.2
177.6
-83.8
104.2
33.8
-141.4
VAL-259
GLN-260
23.9
25.1
173.3
-65.2
57.7
103.0
56.0
GLN-260
LEU-261
26.7
25.6
-2.3
92.1
150.3
141.0
103.5
LEU-261
THR-262
26.3
25.5
15.9
-11.9
74.4
90.3
-12.5
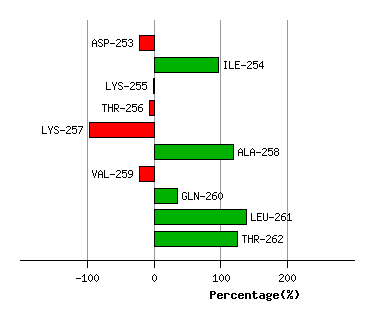
Graph shows rotational transition at bending residues and can be used
to identify hinge bending residues.
Probably only informative for interdomain rotations greater than 20 degrees
Residue
iResidue
i+1Distance of hinge axis to residue i in
(A) Distance of hinge axis to residue i in
(A) Change in
(deg) Change in
(deg) Angle of psi(i) axis to hinge axis
(deg) Angle of psi(i) axis to hinge axis
(deg) Percentage Progress
GLN-346
ASN-347
4.9
5.6
26.3
93.1
40.2
35.9
128.0
ASN-347
GLU-348
2.2
3.0
53.0
-0.5
71.8
23.8
33.6
GLU-348
SER-349
2.7
3.3
-152.0
38.7
169.4
119.4
-118.0
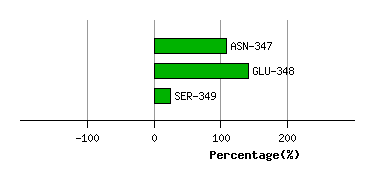
Graph shows rotational transition at bending residues and can be used
to identify hinge bending residues.
Probably only informative for interdomain rotations greater than 20 degrees