Calo1 Methyltransferase
(All numbering and residues are taken from first PDB file)
![]()
![]()
Bending Residue Dihedral Analysis
Residue
iResidue
i+1Distance of hinge axis to residue i in
(A) Distance of hinge axis to residue i in
(A) Change in
(deg) Change in
(deg) Angle of psi(i) axis to hinge axis
(deg) Angle of psi(i) axis to hinge axis
(deg) Percentage Progress
ALA-174
ARG-175
4.8
4.9
-0.1
-2.1
99.8
103.4
-27.0
ARG-175
ALA-176
7.9
8.2
13.0
-17.0
135.0
133.7
40.0
ALA-176
GLY-177
8.0
8.2
-0.8
1.5
93.9
90.5
-36.1
GLY-177
ASP-178
5.4
5.8
162.7
-139.5
56.7
53.7
274.5
ASP-178
PHE-179
8.2
8.3
36.3
-33.1
55.6
47.0
29.1
PHE-179
PRO-180
6.2
6.8
-16.0
2.4
144.0
141.0
-134.3
PRO-180
ALA-181
8.3
8.9
0.8
-5.8
34.5
34.2
-44.5
ALA-181
THR-182
7.6
8.4
3.6
-1.8
64.8
59.8
22.2
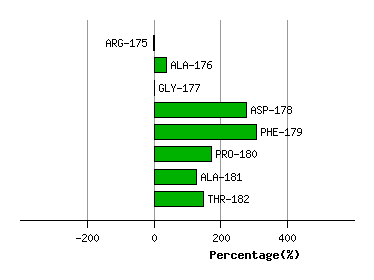
Graph shows rotational transition at bending residues and can be used
to identify hinge bending residues.
Probably only informative for interdomain rotations greater than 20 degrees
Residue
iResidue
i+1Distance of hinge axis to residue i in
(A) Distance of hinge axis to residue i in
(A) Change in
(deg) Change in
(deg) Angle of psi(i) axis to hinge axis
(deg) Angle of psi(i) axis to hinge axis
(deg) Percentage Progress
VAL-216
VAL-217
18.6
18.7
-13.7
21.5
22.6
23.7
-63.3
VAL-217
ALA-218
17.4
17.3
-25.0
8.8
43.9
44.7
151.3
ALA-218
ARG-219
20.5
20.4
-0.5
-7.1
73.4
82.2
-3.7
ARG-219
HIS-220
19.2
19.4
25.7
-23.8
110.3
98.1
15.1
HIS-220
ARG-221
15.5
15.7
-0.8
0.4
44.6
46.2
37.8
ARG-221
LEU-222
13.9
14.5
7.9
3.9
121.1
119.1
-112.9
LEU-222
ASP-223
11.1
11.4
-5.0
1.1
8.3
8.0
40.4
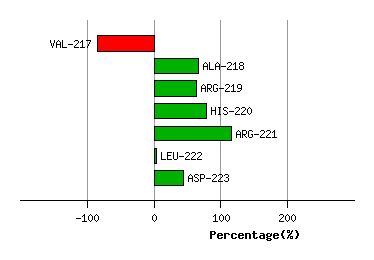
Graph shows rotational transition at bending residues and can be used
to identify hinge bending residues.
Probably only informative for interdomain rotations greater than 20 degrees
Residue
iResidue
i+1Distance of hinge axis to residue i in
(A) Distance of hinge axis to residue i in
(A) Change in
(deg) Change in
(deg) Angle of psi(i) axis to hinge axis
(deg) Angle of psi(i) axis to hinge axis
(deg) Percentage Progress
ASN-256
TRP-257
10.9
11.0
-14.5
19.5
108.1
114.6
-10.5
TRP-257
GLY-258
12.2
12.2
-7.7
14.8
142.0
145.5
43.1
GLY-258
ASP-259
12.8
12.8
17.1
-17.4
108.0
107.9
31.3
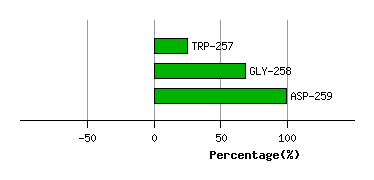
Graph shows rotational transition at bending residues and can be used
to identify hinge bending residues.
Probably only informative for interdomain rotations greater than 20 degrees
Residue
iResidue
i+1Distance of hinge axis to residue i in
(A) Distance of hinge axis to residue i in
(A) Change in
(deg) Change in
(deg) Angle of psi(i) axis to hinge axis
(deg) Angle of psi(i) axis to hinge axis
(deg) Percentage Progress
GLU-260
ASP-261
16.3
16.0
19.5
-1.0
15.0
21.0
224.7
ASP-261
SER-262
15.9
15.8
-4.7
-1.8
121.2
124.2
-48.4
SER-262
VAL-263
12.6
12.5
0.2
0.3
67.1
69.2
27.9
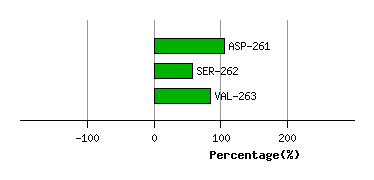
Graph shows rotational transition at bending residues and can be used
to identify hinge bending residues.
Probably only informative for interdomain rotations greater than 20 degrees
Residue
iResidue
i+1Distance of hinge axis to residue i in
(A) Distance of hinge axis to residue i in
(A) Change in
(deg) Change in
(deg) Angle of psi(i) axis to hinge axis
(deg) Angle of psi(i) axis to hinge axis
(deg) Percentage Progress
ASP-283
ALA-284
1.9
1.9
-3.6
5.9
122.5
119.8
-12.8
ALA-284
VAL-285
3.6
3.8
-1.0
9.4
134.8
134.6
84.2
VAL-285
VAL-286
2.4
2.3
7.9
-8.5
42.8
40.8
-7.7
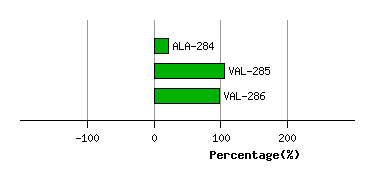
Graph shows rotational transition at bending residues and can be used
to identify hinge bending residues.
Probably only informative for interdomain rotations greater than 20 degrees
Residue
iResidue
i+1Distance of hinge axis to residue i in
(A) Distance of hinge axis to residue i in
(A) Change in
(deg) Change in
(deg) Angle of psi(i) axis to hinge axis
(deg) Angle of psi(i) axis to hinge axis
(deg) Percentage Progress
ALA-304
ALA-305
14.6
14.5
-1.2
5.3
120.9
117.2
5.6
ALA-305
ARG-306
16.1
16.1
2.4
-1.2
93.3
99.9
-6.2
ARG-306
THR-307
15.1
15.1
-32.8
5.2
148.9
140.3
-340.4
THR-307
GLY-308
13.7
14.2
19.3
36.3
77.6
60.9
297.3
GLY-308
GLN-309
10.7
10.8
-23.4
4.6
62.0
54.9
106.1
GLN-309
GLU-310
7.1
7.1
-3.0
-8.1
125.1
129.1
-71.8
GLU-310
ARG-311
3.6
3.8
-2.4
-8.5
60.4
63.8
124.3
ARG-311
THR-312
2.4
2.1
1.5
-7.7
84.6
82.9
-40.8
THR-312
ALA-313
3.4
3.4
0.8
0.5
53.9
56.2
19.4
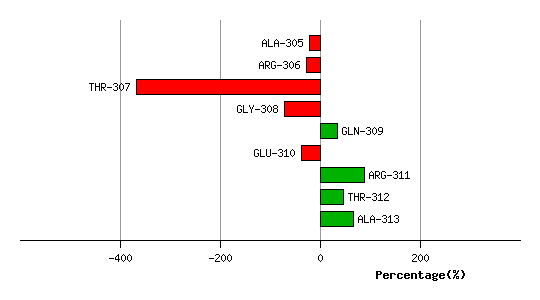
Graph shows rotational transition at bending residues and can be used
to identify hinge bending residues.
Probably only informative for interdomain rotations greater than 20 degrees