D-Maltodextrin-Binding Protein 3
(All numbering and residues are taken from first PDB file)
![]()
![]()
Bending Residue Dihedral Analysis
Residue
iResidue
i+1Distance of hinge axis to residue i in
(A) Distance of hinge axis to residue i in
(A) Change in
(deg) Change in
(deg) Angle of psi(i) axis to hinge axis
(deg) Angle of psi(i) axis to hinge axis
(deg) Percentage Progress
GLU-153
PRO-154
8.9
8.4
13.0
5.5
53.9
59.1
218.9
PRO-154
TYR-155
7.0
6.8
-11.0
4.0
88.1
78.5
-72.4
TYR-155
PHE-156
10.0
9.9
-4.0
-6.8
133.4
132.4
-129.8
PHE-156
THR-157
12.3
12.1
4.8
-6.8
18.3
16.9
46.3
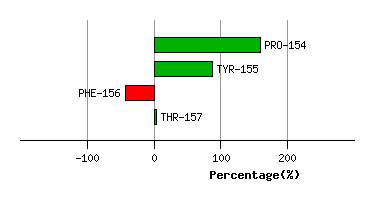
Graph shows rotational transition at bending residues and can be used
to identify hinge bending residues.
Probably only informative for interdomain rotations greater than 20 degrees
Residue
iResidue
i+1Distance of hinge axis to residue i in
(A) Distance of hinge axis to residue i in
(A) Change in
(deg) Change in
(deg) Angle of psi(i) axis to hinge axis
(deg) Angle of psi(i) axis to hinge axis
(deg) Percentage Progress
ASP-164
GLY-165
14.2
14.0
-7.0
13.6
68.7
69.7
-66.3
GLY-165
GLY-166
14.2
14.2
-2.4
-6.9
46.9
41.4
57.3
GLY-166
TYR-167
11.3
11.5
0.1
-4.1
148.3
149.3
-4.4
TYR-167
ALA-168
12.6
12.6
1.8
-0.5
132.1
128.4
-8.2
ALA-168
PHE-169
11.3
11.1
14.5
-9.7
98.3
100.5
-51.6
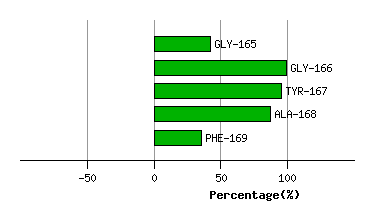
Graph shows rotational transition at bending residues and can be used
to identify hinge bending residues.
Probably only informative for interdomain rotations greater than 20 degrees
Residue
iResidue
i+1Distance of hinge axis to residue i in
(A) Distance of hinge axis to residue i in
(A) Change in
(deg) Change in
(deg) Angle of psi(i) axis to hinge axis
(deg) Angle of psi(i) axis to hinge axis
(deg) Percentage Progress
VAL-183
ASP-184
8.0
8.0
-11.7
3.3
30.3
28.7
335.1
ASP-184
ASN-185
8.0
8.0
2.0
6.2
138.0
136.2
-223.1
ASN-185
ALA-186
10.6
10.7
-8.0
4.5
43.8
43.6
50.7
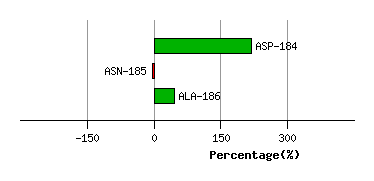
Graph shows rotational transition at bending residues and can be used
to identify hinge bending residues.
Probably only informative for interdomain rotations greater than 20 degrees
Residue
iResidue
i+1Distance of hinge axis to residue i in
(A) Distance of hinge axis to residue i in
(A) Change in
(deg) Change in
(deg) Angle of psi(i) axis to hinge axis
(deg) Angle of psi(i) axis to hinge axis
(deg) Percentage Progress
MET-336
SER-337
8.0
8.3
7.5
1.2
92.2
96.8
55.2
SER-337
ALA-338
4.5
4.8
-5.7
6.0
132.7
136.1
116.6
ALA-338
PHE-339
5.3
5.5
8.0
-8.4
27.3
29.3
-73.3
PHE-339
TRP-340
5.7
5.5
3.6
7.4
83.3
87.0
106.1
TRP-340
TYR-341
3.4
3.2
-14.0
8.7
78.8
75.2
-42.5
TRP-340
TYR-341
3.4
3.2
-14.0
8.7
78.8
75.2
-42.5
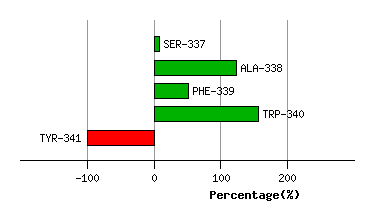
Graph shows rotational transition at bending residues and can be used
to identify hinge bending residues.
Probably only informative for interdomain rotations greater than 20 degrees
Residue
iResidue
i+1Distance of hinge axis to residue i in
(A) Distance of hinge axis to residue i in
(A) Change in
(deg) Change in
(deg) Angle of psi(i) axis to hinge axis
(deg) Angle of psi(i) axis to hinge axis
(deg) Percentage Progress
TRP-340
TYR-341
3.4
3.2
-14.0
8.7
78.8
75.2
-42.5
TRP-340
TYR-341
3.4
3.2
-14.0
8.7
78.8
75.2
-42.5
TYR-341
ALA-342
0.6
0.8
-6.5
-0.6
26.2
23.0
129.6
ALA-342
VAL-343
2.7
2.7
-5.0
4.5
43.8
44.1
-12.7
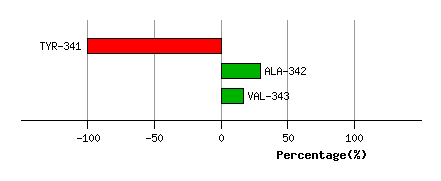
Graph shows rotational transition at bending residues and can be used
to identify hinge bending residues.
Probably only informative for interdomain rotations greater than 20 degrees
Residue
iResidue
i+1Distance of hinge axis to residue i in
(A) Distance of hinge axis to residue i in
(A) Change in
(deg) Change in
(deg) Angle of psi(i) axis to hinge axis
(deg) Angle of psi(i) axis to hinge axis
(deg) Percentage Progress
VAL-347
ILE-348
3.8
3.6
-2.7
7.4
95.6
92.5
9.2
ILE-348
ASN-349
6.7
6.5
1.4
-5.2
48.1
44.6
-13.2
ASN-349
ALA-350
6.7
6.5
0.2
6.7
20.5
19.6
39.0
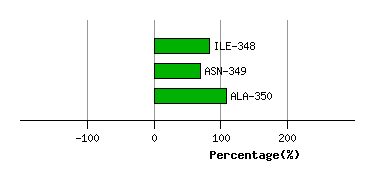
Graph shows rotational transition at bending residues and can be used
to identify hinge bending residues.
Probably only informative for interdomain rotations greater than 20 degrees