Udp-Glucose 4-Epimerase
(All numbering and residues are taken from first PDB file)
![]()
![]()
Bending Residue Dihedral Analysis
Residue
iResidue
i+1Distance of hinge axis to residue i in
(A) Distance of hinge axis to residue i in
(A) Change in
(deg) Change in
(deg) Angle of psi(i) axis to hinge axis
(deg) Angle of psi(i) axis to hinge axis
(deg) Percentage Progress
GLY-133
VAL-134
10.4
9.8
-24.6
19.2
118.9
111.9
-56.8
VAL-134
PRO-135
9.7
8.9
24.7
13.0
112.9
115.7
-147.3
PRO-135
GLU-136
6.1
5.5
-17.1
-22.3
73.6
44.1
194.6
GLU-136
ARG-137
6.5
5.6
17.7
0.8
52.7
82.2
68.6
ARG-137
SER-138
5.2
4.2
-8.9
-6.7
120.7
143.8
14.5
SER-138
PRO-139
3.0
3.5
-14.8
-5.2
90.0
90.9
11.9
PRO-139
ILE-140
3.0
2.7
16.2
16.3
145.2
136.2
-213.6
ILE-140
ASP-141
1.5
1.6
-0.5
-13.5
74.7
77.9
-17.8
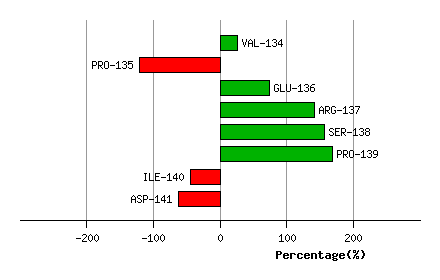
Graph shows rotational transition at bending residues and can be used
to identify hinge bending residues.
Probably only informative for interdomain rotations greater than 20 degrees
Residue
iResidue
i+1Distance of hinge axis to residue i in
(A) Distance of hinge axis to residue i in
(A) Change in
(deg) Change in
(deg) Angle of psi(i) axis to hinge axis
(deg) Angle of psi(i) axis to hinge axis
(deg) Percentage Progress
LEU-203
MET-204
10.5
10.4
20.7
21.8
32.7
29.9
363.5
MET-204
PRO-205
9.1
8.8
-8.3
-0.2
133.0
136.5
-163.8
PRO-205
TYR-206
12.5
12.0
0.9
-4.6
61.7
60.0
33.2
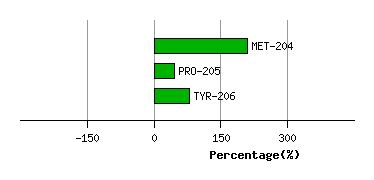
Graph shows rotational transition at bending residues and can be used
to identify hinge bending residues.
Probably only informative for interdomain rotations greater than 20 degrees
Residue
iResidue
i+1Distance of hinge axis to residue i in
(A) Distance of hinge axis to residue i in
(A) Change in
(deg) Change in
(deg) Angle of psi(i) axis to hinge axis
(deg) Angle of psi(i) axis to hinge axis
(deg) Percentage Progress
VAL-233
ARG-234
5.8
6.0
-11.0
15.2
114.9
113.6
59.9
ARG-234
ASP-235
3.6
4.3
9.8
-13.8
100.1
97.6
3.6
ASP-235
TYR-236
2.4
3.2
19.3
-43.5
128.9
127.0
133.8
TYR-236
ILE-237
4.5
5.1
7.6
-0.5
88.7
91.7
-19.4
ILE-237
HIS-238
7.7
7.8
4.8
-4.1
133.4
139.4
13.5
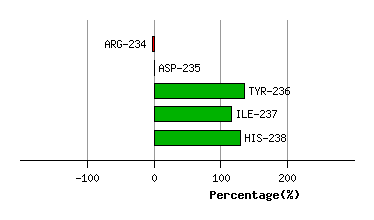
Graph shows rotational transition at bending residues and can be used
to identify hinge bending residues.
Probably only informative for interdomain rotations greater than 20 degrees
Residue
iResidue
i+1Distance of hinge axis to residue i in
(A) Distance of hinge axis to residue i in
(A) Change in
(deg) Change in
(deg) Angle of psi(i) axis to hinge axis
(deg) Angle of psi(i) axis to hinge axis
(deg) Percentage Progress
ARG-268
GLY-269
4.3
4.5
2.5
7.7
72.4
74.6
-82.8
GLY-269
TYR-270
2.0
1.7
15.6
11.1
30.2
26.1
214.4
TYR-270
SER-271
3.0
2.4
-9.6
3.3
90.4
90.1
2.8
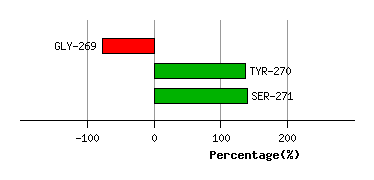
Graph shows rotational transition at bending residues and can be used
to identify hinge bending residues.
Probably only informative for interdomain rotations greater than 20 degrees
Residue
iResidue
i+1Distance of hinge axis to residue i in
(A) Distance of hinge axis to residue i in
(A) Change in
(deg) Change in
(deg) Angle of psi(i) axis to hinge axis
(deg) Angle of psi(i) axis to hinge axis
(deg) Percentage Progress
CYS-302
TYR-303
3.9
4.3
-13.5
1.7
61.1
67.0
98.5
TYR-303
ALA-304
0.8
1.0
-3.5
-14.0
138.0
139.0
-97.5
ALA-304
ASN-305
3.7
3.3
4.4
-7.1
74.5
91.9
94.0
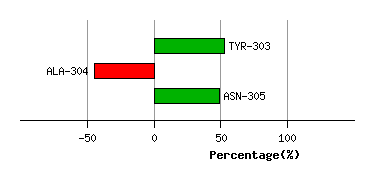
Graph shows rotational transition at bending residues and can be used
to identify hinge bending residues.
Probably only informative for interdomain rotations greater than 20 degrees