Periplasmic Oligo-Peptide Binding Protein
(All numbering and residues are taken from first PDB file)
![]()
![]()
Bending Residue Dihedral Analysis
Residue
iResidue
i+1Distance of hinge axis to residue i in
(A) Distance of hinge axis to residue i in
(A) Change in
(deg) Change in
(deg) Angle of psi(i) axis to hinge axis
(deg) Angle of psi(i) axis to hinge axis
(deg) Percentage Progress
TYR-245
ASN-246
11.3
11.0
-11.0
17.6
81.9
84.6
0.3
ASN-246
ASN-247
7.5
7.2
-16.5
8.5
85.5
71.6
69.2
ASN-247
MET-248
7.5
6.8
-1.7
6.7
10.2
11.6
-35.0
MET-248
PRO-249
6.2
5.4
-13.3
16.3
55.6
59.7
15.6
PRO-249
ILE-250
7.8
6.6
-8.7
15.9
58.4
68.5
10.3
ILE-250
GLU-251
7.1
5.0
-16.7
-5.9
13.9
17.0
92.8
GLU-251
LEU-252
7.9
5.2
-10.6
55.0
70.5
77.5
-66.9
LEU-252
PHE-253
5.7
4.8
-29.5
14.6
113.2
105.5
-67.6
PHE-253
GLN-254
2.9
2.2
-0.4
-3.1
57.1
53.8
-24.2
GLN-254
LYS-255
0.2
0.9
-0.3
2.0
51.3
44.9
5.9
LYS-255
LEU-256
2.6
2.8
-13.0
8.8
118.1
117.6
12.1
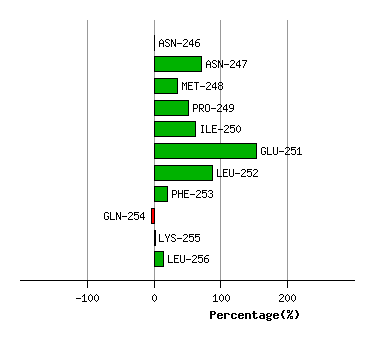
Graph shows rotational transition at bending residues and can be used
to identify hinge bending residues.
Probably only informative for interdomain rotations greater than 20 degrees
Residue
iResidue
i+1Distance of hinge axis to residue i in
(A) Distance of hinge axis to residue i in
(A) Change in
(deg) Change in
(deg) Angle of psi(i) axis to hinge axis
(deg) Angle of psi(i) axis to hinge axis
(deg) Percentage Progress
PRO-268
TYR-269
5.5
5.8
-0.5
8.1
118.8
121.2
4.8
TYR-269
LEU-270
2.3
2.7
7.7
11.0
48.5
43.0
47.8
LEU-270
CYS-271
1.3
1.5
-5.2
-4.4
90.0
85.0
38.7
CYS-271
THR-272
3.0
2.9
-5.2
5.4
68.3
68.5
-7.7
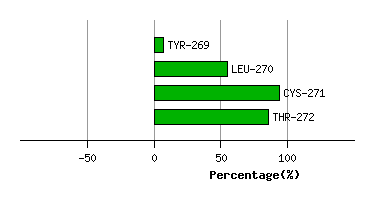
Graph shows rotational transition at bending residues and can be used
to identify hinge bending residues.
Probably only informative for interdomain rotations greater than 20 degrees
Residue
iResidue
i+1Distance of hinge axis to residue i in
(A) Distance of hinge axis to residue i in
(A) Change in
(deg) Change in
(deg) Angle of psi(i) axis to hinge axis
(deg) Angle of psi(i) axis to hinge axis
(deg) Percentage Progress
TYR-485
VAL-486
3.1
3.1
-4.6
3.9
95.8
99.2
6.4
VAL-486
ASN-487
1.7
2.6
-6.3
-2.4
92.5
93.5
27.6
ASN-487
ALA-488
3.1
3.4
10.1
-3.4
24.6
29.2
34.0
ALA-488
ARG-489
3.8
4.3
2.1
2.7
78.4
76.5
-32.2
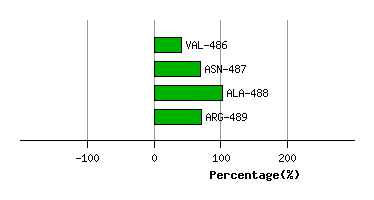
Graph shows rotational transition at bending residues and can be used
to identify hinge bending residues.
Probably only informative for interdomain rotations greater than 20 degrees