Actin-Like Protein 3
(All numbering and residues are taken from first PDB file)
![]()
![]()
Bending Residue Dihedral Analysis
Residue
iResidue
i+1Distance of hinge axis to residue i in
(A) Distance of hinge axis to residue i in
(A) Change in
(deg) Change in
(deg) Angle of psi(i) axis to hinge axis
(deg) Angle of psi(i) axis to hinge axis
(deg) Percentage Progress
LEU-149
ALA-150
7.2
7.5
12.0
-10.8
117.3
114.1
75.5
ALA-150
ALA-151
10.6
10.9
-3.2
-0.3
10.5
9.8
74.1
ALA-151
SER-152
9.4
9.9
5.0
-1.3
106.4
105.4
-40.3
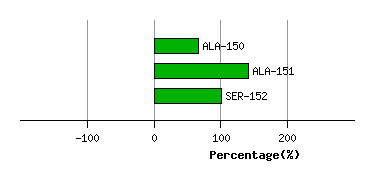
Graph shows rotational transition at bending residues and can be used
to identify hinge bending residues.
Probably only informative for interdomain rotations greater than 20 degrees
Residue
iResidue
i+1Distance of hinge axis to residue i in
(A) Distance of hinge axis to residue i in
(A) Change in
(deg) Change in
(deg) Angle of psi(i) axis to hinge axis
(deg) Angle of psi(i) axis to hinge axis
(deg) Percentage Progress
GLY-159
GLU-160
14.0
13.5
-35.5
6.8
40.5
55.9
344.8
GLU-160
ARG-161
14.0
14.1
3.7
16.0
99.0
106.7
-184.6
ARG-161
THR-162
12.9
12.9
2.2
-2.8
157.6
159.4
-28.0
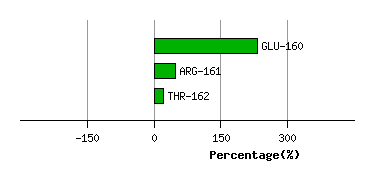
Graph shows rotational transition at bending residues and can be used
to identify hinge bending residues.
Probably only informative for interdomain rotations greater than 20 degrees
Residue
iResidue
i+1Distance of hinge axis to residue i in
(A) Distance of hinge axis to residue i in
(A) Change in
(deg) Change in
(deg) Angle of psi(i) axis to hinge axis
(deg) Angle of psi(i) axis to hinge axis
(deg) Percentage Progress
LEU-163
THR-164
9.0
9.1
-6.9
8.6
130.0
128.2
14.4
THR-164
GLY-165
6.1
6.2
2.8
-4.9
130.9
131.8
14.1
GLY-165
THR-166
2.8
2.9
-6.3
8.6
94.3
93.6
38.9
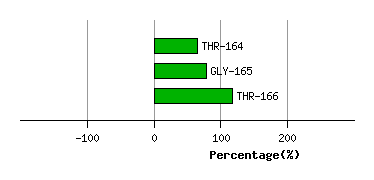
Graph shows rotational transition at bending residues and can be used
to identify hinge bending residues.
Probably only informative for interdomain rotations greater than 20 degrees
Residue
iResidue
i+1Distance of hinge axis to residue i in
(A) Distance of hinge axis to residue i in
(A) Change in
(deg) Change in
(deg) Angle of psi(i) axis to hinge axis
(deg) Angle of psi(i) axis to hinge axis
(deg) Percentage Progress
GLY-171
ASP-172
14.6
14.4
19.1
-8.5
69.3
69.7
1.9
ASP-172
GLY-173
17.9
17.9
-5.5
7.1
42.6
42.9
51.6
GLY-173
VAL-174
19.5
19.4
-29.3
14.1
55.1
67.2
201.2
VAL-174
THR-175
17.1
17.3
-1.8
12.9
97.1
91.5
38.5
THR-175
HIS-176
13.5
13.6
9.0
-10.9
157.4
158.1
33.5
HIS-176
VAL-177
11.3
11.4
-11.2
12.4
86.2
86.5
-25.9
VAL-177
ILE-178
8.2
8.2
-1.7
1.5
44.3
42.5
-14.8
ILE-178
PRO-179
6.8
6.9
4.0
-1.2
76.1
77.8
13.0
ILE-178
PRO-179
6.8
6.9
4.0
-1.2
76.1
77.8
13.0
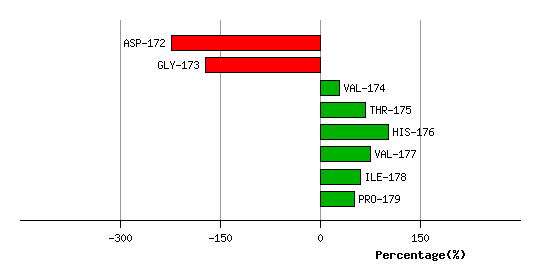
Graph shows rotational transition at bending residues and can be used
to identify hinge bending residues.
Probably only informative for interdomain rotations greater than 20 degrees
Residue
iResidue
i+1Distance of hinge axis to residue i in
(A) Distance of hinge axis to residue i in
(A) Change in
(deg) Change in
(deg) Angle of psi(i) axis to hinge axis
(deg) Angle of psi(i) axis to hinge axis
(deg) Percentage Progress
ILE-178
PRO-179
6.8
6.9
4.0
-1.2
76.1
77.8
13.0
ILE-178
PRO-179
6.8
6.9
4.0
-1.2
76.1
77.8
13.0
PRO-179
VAL-180
3.7
3.7
5.0
-6.5
75.8
75.9
-15.1
VAL-180
ALA-181
4.9
5.0
-2.1
4.6
112.7
110.9
20.9
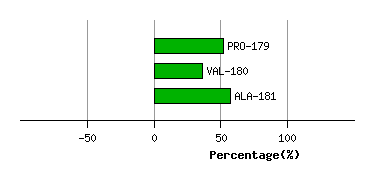
Graph shows rotational transition at bending residues and can be used
to identify hinge bending residues.
Probably only informative for interdomain rotations greater than 20 degrees
Residue
iResidue
i+1Distance of hinge axis to residue i in
(A) Distance of hinge axis to residue i in
(A) Change in
(deg) Change in
(deg) Angle of psi(i) axis to hinge axis
(deg) Angle of psi(i) axis to hinge axis
(deg) Percentage Progress
GLY-183
TYR-184
10.6
10.6
-12.1
8.7
62.6
65.1
52.6
TYR-184
VAL-185
9.9
9.9
17.4
-17.0
89.9
87.2
44.7
VAL-185
ILE-186
8.3
8.3
-2.3
7.8
23.5
28.0
-80.5
ILE-186
GLY-187
6.6
6.4
-7.9
1.9
86.6
85.0
2.4
ILE-186
GLY-187
6.6
6.4
-7.9
1.9
86.6
85.0
2.4
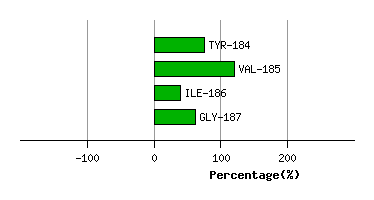
Graph shows rotational transition at bending residues and can be used
to identify hinge bending residues.
Probably only informative for interdomain rotations greater than 20 degrees
Residue
iResidue
i+1Distance of hinge axis to residue i in
(A) Distance of hinge axis to residue i in
(A) Change in
(deg) Change in
(deg) Angle of psi(i) axis to hinge axis
(deg) Angle of psi(i) axis to hinge axis
(deg) Percentage Progress
ILE-186
GLY-187
6.6
6.4
-7.9
1.9
86.6
85.0
2.4
ILE-186
GLY-187
6.6
6.4
-7.9
1.9
86.6
85.0
2.4
GLY-187
SER-188
9.9
9.7
4.1
-4.7
63.4
62.5
-40.5
SER-188
CYS-189
9.5
9.3
5.2
-6.1
116.3
114.2
3.4
CYS-189
ILE-190
7.7
7.5
5.3
-6.4
19.3
17.8
-59.8
CYS-189
ILE-190
7.7
7.5
5.3
-6.4
19.3
17.8
-59.8
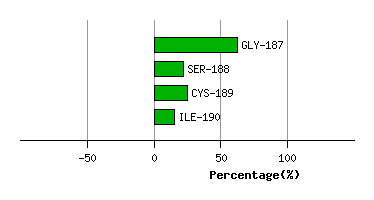
Graph shows rotational transition at bending residues and can be used
to identify hinge bending residues.
Probably only informative for interdomain rotations greater than 20 degrees
Residue
iResidue
i+1Distance of hinge axis to residue i in
(A) Distance of hinge axis to residue i in
(A) Change in
(deg) Change in
(deg) Angle of psi(i) axis to hinge axis
(deg) Angle of psi(i) axis to hinge axis
(deg) Percentage Progress
CYS-189
ILE-190
7.7
7.5
5.3
-6.4
19.3
17.8
-59.8
CYS-189
ILE-190
7.7
7.5
5.3
-6.4
19.3
17.8
-59.8
ILE-190
LYS-191
9.6
9.4
-4.5
3.6
93.4
97.6
-38.9
LYS-191
HIS-192
11.8
11.7
6.3
-3.2
25.6
26.2
94.9
HIS-192
ILE-193
14.4
14.2
3.1
-7.1
68.9
63.8
-54.7
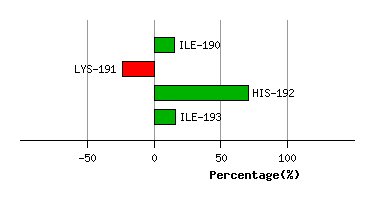
Graph shows rotational transition at bending residues and can be used
to identify hinge bending residues.
Probably only informative for interdomain rotations greater than 20 degrees
Residue
iResidue
i+1Distance of hinge axis to residue i in
(A) Distance of hinge axis to residue i in
(A) Change in
(deg) Change in
(deg) Angle of psi(i) axis to hinge axis
(deg) Angle of psi(i) axis to hinge axis
(deg) Percentage Progress
CYS-307
PRO-308
3.1
3.2
3.7
-7.9
126.3
127.3
20.7
PRO-308
ILE-309
2.2
2.6
-4.7
9.0
113.1
115.8
63.5
ILE-309
ASP-310
5.9
6.3
-4.8
8.2
121.3
118.7
38.8
ASP-310
VAL-311
6.9
7.0
0.9
-11.1
25.8
27.0
-198.6
VAL-311
ARG-312
4.7
5.0
14.2
17.9
50.6
47.1
364.1
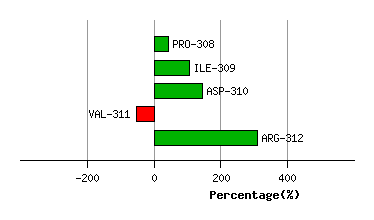
Graph shows rotational transition at bending residues and can be used
to identify hinge bending residues.
Probably only informative for interdomain rotations greater than 20 degrees
Residue
iResidue
i+1Distance of hinge axis to residue i in
(A) Distance of hinge axis to residue i in
(A) Change in
(deg) Change in
(deg) Angle of psi(i) axis to hinge axis
(deg) Angle of psi(i) axis to hinge axis
(deg) Percentage Progress
TYR-316
LYS-317
6.1
6.1
-2.5
7.6
37.7
37.2
-105.1
LYS-317
ASN-318
7.2
7.1
-1.6
-3.2
55.2
53.6
100.9
ASN-318
ILE-319
4.3
4.0
7.7
-4.3
95.6
93.6
19.3
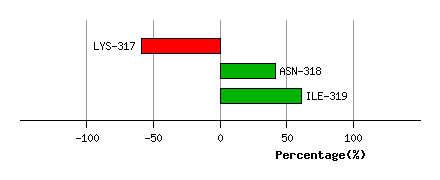
Graph shows rotational transition at bending residues and can be used
to identify hinge bending residues.
Probably only informative for interdomain rotations greater than 20 degrees
Residue
iResidue
i+1Distance of hinge axis to residue i in
(A) Distance of hinge axis to residue i in
(A) Change in
(deg) Change in
(deg) Angle of psi(i) axis to hinge axis
(deg) Angle of psi(i) axis to hinge axis
(deg) Percentage Progress
VAL-320
LEU-321
1.3
1.5
-1.2
4.7
108.0
106.7
3.5
LEU-321
SER-322
3.9
3.9
6.9
-2.8
72.0
77.2
20.7
SER-322
GLY-323
7.4
7.4
-0.4
-7.3
101.1
104.8
-40.7
GLY-323
GLY-324
10.3
10.4
-2.3
-5.5
151.5
152.2
-163.7
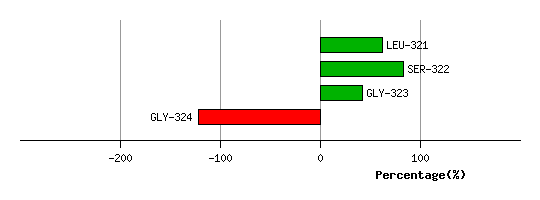
Graph shows rotational transition at bending residues and can be used
to identify hinge bending residues.
Probably only informative for interdomain rotations greater than 20 degrees
Residue
iResidue
i+1Distance of hinge axis to residue i in
(A) Distance of hinge axis to residue i in
(A) Change in
(deg) Change in
(deg) Angle of psi(i) axis to hinge axis
(deg) Angle of psi(i) axis to hinge axis
(deg) Percentage Progress
VAL-343
ASP-344
14.7
14.9
9.1
-2.9
94.1
89.4
-13.8
ASP-344
ALA-345
17.8
18.0
1.5
-8.6
117.3
119.6
72.5
ALA-345
ARG-346
20.2
20.5
-14.0
12.8
4.9
8.6
19.1
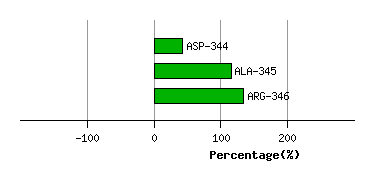
Graph shows rotational transition at bending residues and can be used
to identify hinge bending residues.
Probably only informative for interdomain rotations greater than 20 degrees
Residue
iResidue
i+1Distance of hinge axis to residue i in
(A) Distance of hinge axis to residue i in
(A) Change in
(deg) Change in
(deg) Angle of psi(i) axis to hinge axis
(deg) Angle of psi(i) axis to hinge axis
(deg) Percentage Progress
LEU-347
LYS-348
18.9
18.8
-19.8
6.2
83.5
91.9
19.5
LYS-348
LEU-349
22.5
22.5
2.4
10.6
31.3
36.4
188.9
LEU-349
SER-350
23.4
23.5
-30.3
28.8
142.6
144.2
-66.1
SER-350
GLU-351
21.7
21.8
-13.5
14.3
93.6
93.3
-95.8
GLU-351
GLU-352
24.4
24.2
3.8
7.1
72.7
74.7
-7.0
GLU-352
LEU-353
26.9
27.0
18.9
-10.6
20.3
11.2
167.7
PRO-360
LYS-361
19.0
19.1
-27.3
5.4
26.8
19.7
384.8
LYS-361
PRO-362
18.4
18.6
-6.5
3.0
49.6
52.4
55.6
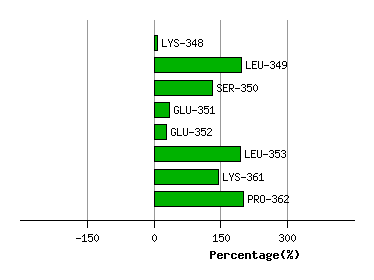
Graph shows rotational transition at bending residues and can be used
to identify hinge bending residues.
Probably only informative for interdomain rotations greater than 20 degrees
Residue
iResidue
i+1Distance of hinge axis to residue i in
(A) Distance of hinge axis to residue i in
(A) Change in
(deg) Change in
(deg) Angle of psi(i) axis to hinge axis
(deg) Angle of psi(i) axis to hinge axis
(deg) Percentage Progress
GLN-366
VAL-367
7.5
7.5
-6.4
3.4
100.8
100.0
76.9
VAL-367
ILE-368
4.6
4.5
-15.1
16.8
139.9
139.6
6.6
ILE-368
THR-369
3.0
2.9
-0.5
-0.6
130.0
128.1
-7.1
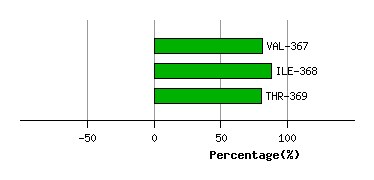
Graph shows rotational transition at bending residues and can be used
to identify hinge bending residues.
Probably only informative for interdomain rotations greater than 20 degrees