Caffeic Acid 3-O-Methyltransferase
(All numbering and residues are taken from first PDB file)
![]()
![]()
Bending Residue Dihedral Analysis
Residue
iResidue
i+1Distance of hinge axis to residue i in
(A) Distance of hinge axis to residue i in
(A) Change in
(deg) Change in
(deg) Angle of psi(i) axis to hinge axis
(deg) Angle of psi(i) axis to hinge axis
(deg) Percentage Progress
THR-187
MET-188
5.4
5.6
10.0
-7.2
39.4
41.9
30.2
MET-188
LYS-189
4.1
4.3
5.4
0.0
48.9
48.1
57.3
LYS-189
LYS-190
5.5
5.6
-26.6
32.4
77.9
75.0
-49.1
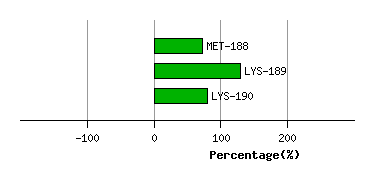
Graph shows rotational transition at bending residues and can be used
to identify hinge bending residues.
Probably only informative for interdomain rotations greater than 20 degrees
Residue
iResidue
i+1Distance of hinge axis to residue i in
(A) Distance of hinge axis to residue i in
(A) Change in
(deg) Change in
(deg) Angle of psi(i) axis to hinge axis
(deg) Angle of psi(i) axis to hinge axis
(deg) Percentage Progress
GLU-297
CYS-298
3.6
3.7
3.8
-0.4
64.1
64.4
68.1
CYS-298
ILE-299
1.0
1.1
5.3
-4.6
53.2
58.5
-14.7
ILE-299
LEU-300
3.8
3.9
2.6
-8.3
35.9
34.7
-20.2
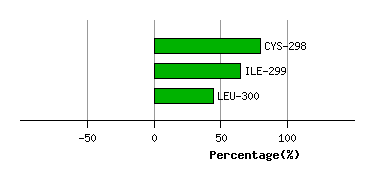
Graph shows rotational transition at bending residues and can be used
to identify hinge bending residues.
Probably only informative for interdomain rotations greater than 20 degrees
Residue
iResidue
i+1Distance of hinge axis to residue i in
(A) Distance of hinge axis to residue i in
(A) Change in
(deg) Change in
(deg) Angle of psi(i) axis to hinge axis
(deg) Angle of psi(i) axis to hinge axis
(deg) Percentage Progress
ALA-322
HIS-323
13.3
13.3
9.8
-5.7
61.3
63.0
45.7
HIS-323
ASN-324
15.3
15.5
11.7
-77.2
72.2
72.8
-303.4
ASN-324
PRO-325
14.0
14.8
-28.1
38.7
64.8
44.8
47.0
PRO-325
GLY-326
16.7
16.0
-40.3
91.6
63.0
93.8
47.0
GLY-326
GLY-327
14.3
14.3
-33.2
36.9
122.3
122.2
51.4
GLY-327
LYS-328
11.4
11.4
-10.5
-16.2
67.4
56.4
185.0
LYS-328
GLU-329
7.7
7.8
-13.2
-0.6
128.6
130.9
-101.2
GLU-329
ARG-330
4.6
4.7
-6.0
3.5
69.9
71.7
48.3
ARG-330
THR-331
6.1
6.2
-3.0
7.0
100.2
100.6
15.9
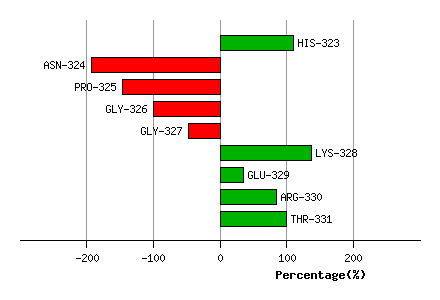
Graph shows rotational transition at bending residues and can be used
to identify hinge bending residues.
Probably only informative for interdomain rotations greater than 20 degrees
Residue
iResidue
i+1Distance of hinge axis to residue i in
(A) Distance of hinge axis to residue i in
(A) Change in
(deg) Change in
(deg) Angle of psi(i) axis to hinge axis
(deg) Angle of psi(i) axis to hinge axis
(deg) Percentage Progress
ASN-352
ALA-353
6.4
5.8
8.4
-11.4
120.9
123.8
91.9
ALA-353
PHE-354
4.9
4.7
5.5
-0.3
49.2
47.7
122.0
PHE-354
ASN-355
6.7
6.4
14.4
-21.2
32.6
37.9
-152.0
ASN-355
THR-356
5.0
4.7
22.9
-18.5
83.6
83.4
4.4
ASN-355
THR-356
5.0
4.7
22.9
-18.5
83.6
83.4
4.4
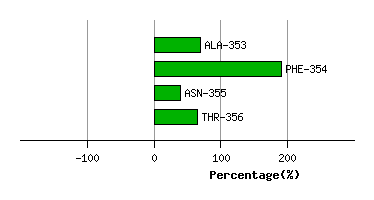
Graph shows rotational transition at bending residues and can be used
to identify hinge bending residues.
Probably only informative for interdomain rotations greater than 20 degrees
Residue
iResidue
i+1Distance of hinge axis to residue i in
(A) Distance of hinge axis to residue i in
(A) Change in
(deg) Change in
(deg) Angle of psi(i) axis to hinge axis
(deg) Angle of psi(i) axis to hinge axis
(deg) Percentage Progress
ASN-355
THR-356
5.0
4.7
22.9
-18.5
83.6
83.4
4.4
ASN-355
THR-356
5.0
4.7
22.9
-18.5
83.6
83.4
4.4
THR-356
TYR-357
1.5
1.3
6.2
-5.4
64.5
65.7
20.5
TYR-357
ILE-358
3.9
3.8
-1.3
1.1
124.8
124.9
-1.5
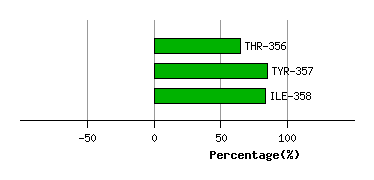
Graph shows rotational transition at bending residues and can be used
to identify hinge bending residues.
Probably only informative for interdomain rotations greater than 20 degrees