Aldose Reductase
(All numbering and residues are taken from first PDB file)
![]()
![]()
Bending Residue Dihedral Analysis
Residue
iResidue
i+1Distance of hinge axis to residue i in
(A) Distance of hinge axis to residue i in
(A) Change in
(deg) Change in
(deg) Angle of psi(i) axis to hinge axis
(deg) Angle of psi(i) axis to hinge axis
(deg) Percentage Progress
ALA-208
TYR-209
12.0
12.2
6.9
-6.9
155.8
154.8
-13.7
TYR-209
SER-210
13.9
14.3
-4.9
6.0
67.1
56.4
1.4
SER-210
PRO-211
13.9
14.4
-12.2
10.4
106.2
99.0
-23.2
PRO-211
LEU-212
10.5
10.8
-10.4
-1.0
56.7
47.1
19.7
LEU-212
GLY-213
11.2
10.8
0.2
26.3
90.7
99.7
-12.6
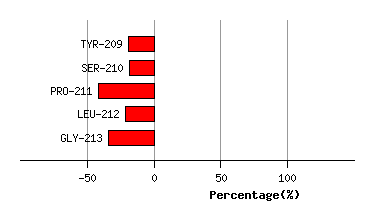
Graph shows rotational transition at bending residues and can be used
to identify hinge bending residues.
Probably only informative for interdomain rotations greater than 20 degrees
Residue
iResidue
i+1Distance of hinge axis to residue i in
(A) Distance of hinge axis to residue i in
(A) Change in
(deg) Change in
(deg) Angle of psi(i) axis to hinge axis
(deg) Angle of psi(i) axis to hinge axis
(deg) Percentage Progress
PRO-252
MET-253
5.2
5.4
7.5
-12.1
113.4
115.3
20.8
MET-253
GLN-254
3.6
3.4
11.1
-6.0
139.9
134.1
-28.6
GLN-254
ARG-255
0.5
0.6
17.3
-34.8
143.5
140.1
58.5
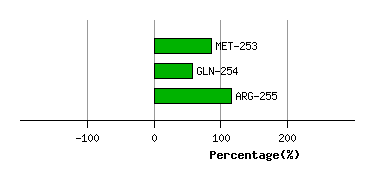
Graph shows rotational transition at bending residues and can be used
to identify hinge bending residues.
Probably only informative for interdomain rotations greater than 20 degrees
Residue
iResidue
i+1Distance of hinge axis to residue i in
(A) Distance of hinge axis to residue i in
(A) Change in
(deg) Change in
(deg) Angle of psi(i) axis to hinge axis
(deg) Angle of psi(i) axis to hinge axis
(deg) Percentage Progress
ASN-256
LEU-257
4.7
5.0
-15.4
-0.1
77.8
73.6
27.9
LEU-257
VAL-258
7.5
7.8
-7.2
0.5
41.7
36.0
26.6
VAL-258
VAL-259
9.7
9.4
3.1
5.2
134.0
132.0
-32.5
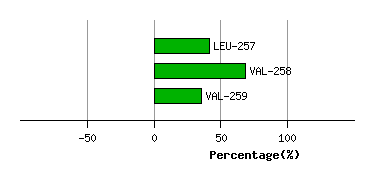
Graph shows rotational transition at bending residues and can be used
to identify hinge bending residues.
Probably only informative for interdomain rotations greater than 20 degrees
Residue
iResidue
i+1Distance of hinge axis to residue i in
(A) Distance of hinge axis to residue i in
(A) Change in
(deg) Change in
(deg) Angle of psi(i) axis to hinge axis
(deg) Angle of psi(i) axis to hinge axis
(deg) Percentage Progress
THR-265
PRO-266
11.7
11.6
-34.6
1.2
80.5
71.4
49.1
PRO-266
GLU-267
10.9
11.4
13.3
-17.4
104.9
94.9
35.0
GLU-267
ALA-268
7.1
7.6
12.4
-19.0
168.1
146.8
41.7
ALA-268
ILE-269
7.5
6.9
6.7
3.5
126.4
142.2
-50.7
ILE-269
ALA-270
9.6
9.5
-1.8
5.7
86.3
75.0
-14.4
ALA-270
GLU-271
8.0
8.5
-7.6
15.4
60.9
65.4
-13.0
GLU-271
ASN-272
4.4
4.8
-11.0
10.4
5.8
13.3
11.3
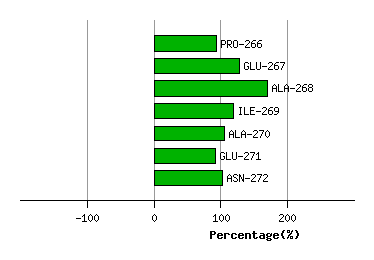
Graph shows rotational transition at bending residues and can be used
to identify hinge bending residues.
Probably only informative for interdomain rotations greater than 20 degrees
Residue
iResidue
i+1Distance of hinge axis to residue i in
(A) Distance of hinge axis to residue i in
(A) Change in
(deg) Change in
(deg) Angle of psi(i) axis to hinge axis
(deg) Angle of psi(i) axis to hinge axis
(deg) Percentage Progress
PHE-276
ASP-277
7.3
6.7
8.1
-4.1
85.9
91.6
9.9
ASP-277
PHE-278
8.9
8.3
15.3
-16.2
76.6
84.8
-1.7
PHE-278
GLU-279
7.5
7.2
3.1
-9.3
35.0
33.8
18.4
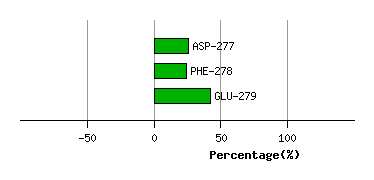
Graph shows rotational transition at bending residues and can be used
to identify hinge bending residues.
Probably only informative for interdomain rotations greater than 20 degrees
Residue
iResidue
i+1Distance of hinge axis to residue i in
(A) Distance of hinge axis to residue i in
(A) Change in
(deg) Change in
(deg) Angle of psi(i) axis to hinge axis
(deg) Angle of psi(i) axis to hinge axis
(deg) Percentage Progress
SER-282
GLN-283
9.6
9.8
4.0
-5.2
65.1
69.4
-10.1
GLN-283
ASP-284
12.3
12.4
-5.1
6.0
135.4
132.3
37.3
ASP-284
MET-285
10.0
10.3
-1.3
8.2
65.5
61.9
2.1
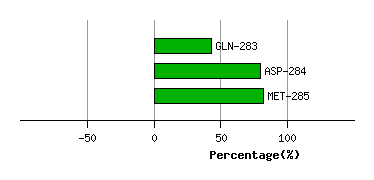
Graph shows rotational transition at bending residues and can be used
to identify hinge bending residues.
Probably only informative for interdomain rotations greater than 20 degrees