6-Phosphogluconate Dehydrogenase, Decarboxylating
(All numbering and residues are taken from first PDB file)
![]()
![]()
Bending Residue Dihedral Analysis
Residue
iResidue
i+1Distance of hinge axis to residue i in
(A) Distance of hinge axis to residue i in
(A) Change in
(deg) Change in
(deg) Angle of psi(i) axis to hinge axis
(deg) Angle of psi(i) axis to hinge axis
(deg) Percentage Progress
MET-73
VAL-74
10.0
10.2
-24.0
32.2
61.0
61.4
54.9
VAL-74
LYS-75
12.2
12.4
13.7
-25.3
113.0
97.9
125.4
LYS-75
ALA-76
13.5
12.9
-11.1
13.9
41.1
38.2
-42.8
ALA-76
GLY-77
11.2
10.3
-13.5
62.0
22.3
39.3
-485.0
GLY-77
ALA-78
11.2
11.6
22.3
-65.9
108.7
137.3
256.0
ALA-78
GLY-79
12.9
12.0
30.2
-17.8
47.0
62.7
30.8
GLY-79
THR-80
14.1
13.4
40.1
-16.3
73.6
69.2
95.4
THR-80
ASP-81
10.6
10.0
-4.8
-9.3
40.8
45.8
109.5
ASP-81
ALA-82
9.9
9.6
24.4
-10.5
95.0
97.5
-36.3
ALA-82
ALA-83
13.5
13.3
-7.4
0.8
138.0
133.8
-90.9
ALA-83
ILE-84
13.6
13.3
7.2
-4.4
97.8
100.9
6.5
ILE-84
ASP-85
11.1
11.2
-0.8
6.1
39.7
41.1
-10.2
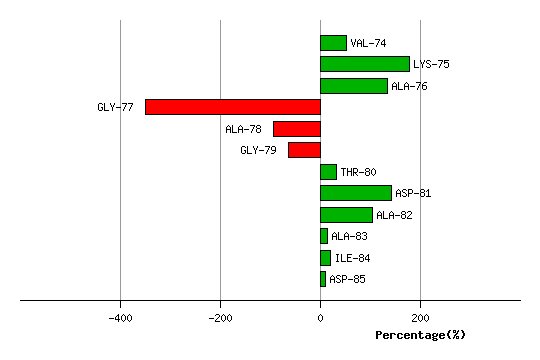
Graph shows rotational transition at bending residues and can be used
to identify hinge bending residues.
Probably only informative for interdomain rotations greater than 20 degrees
Residue
iResidue
i+1Distance of hinge axis to residue i in
(A) Distance of hinge axis to residue i in
(A) Change in
(deg) Change in
(deg) Angle of psi(i) axis to hinge axis
(deg) Angle of psi(i) axis to hinge axis
(deg) Percentage Progress
ILE-97
ILE-98
9.1
8.8
10.2
-4.4
69.0
65.3
58.4
ILE-98
ASP-99
6.0
5.8
-5.3
1.3
77.4
84.1
-23.8
ASP-99
GLY-100
4.9
4.8
1.0
6.1
49.1
49.3
46.0
GLY-100
GLY-101
4.8
4.9
3.3
1.4
99.6
102.4
-21.3
GLY-101
ASN-102
7.5
7.5
-2.3
-3.5
75.7
84.3
17.0
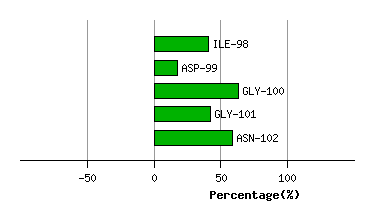
Graph shows rotational transition at bending residues and can be used
to identify hinge bending residues.
Probably only informative for interdomain rotations greater than 20 degrees
Residue
iResidue
i+1Distance of hinge axis to residue i in
(A) Distance of hinge axis to residue i in
(A) Change in
(deg) Change in
(deg) Angle of psi(i) axis to hinge axis
(deg) Angle of psi(i) axis to hinge axis
(deg) Percentage Progress
ILE-109
ARG-110
3.4
3.3
2.8
1.9
44.8
42.6
48.4
ARG-110
ARG-111
1.3
1.0
-2.2
1.4
69.5
71.3
16.3
ARG-111
ASN-112
2.9
2.9
-2.5
-4.8
65.2
70.9
28.9
ASN-112
ARG-113
4.5
4.6
2.6
5.7
49.4
39.7
63.2
ARG-113
GLU-114
6.5
5.9
-4.7
-2.7
111.3
116.1
-31.3
GLU-114
LEU-115
6.8
6.3
5.4
0.5
128.7
120.7
-38.0
LEU-115
SER-116
8.6
8.5
-5.4
10.1
76.2
86.0
13.2
SER-116
ALA-117
10.3
10.2
-3.5
6.0
139.4
142.5
28.2
ALA-117
GLU-118
11.7
11.3
4.1
-18.8
87.4
90.7
-13.6
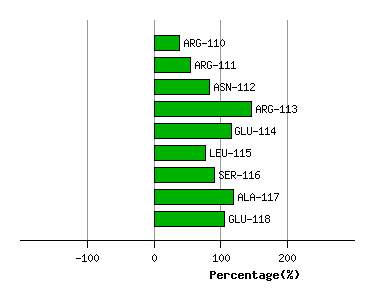
Graph shows rotational transition at bending residues and can be used
to identify hinge bending residues.
Probably only informative for interdomain rotations greater than 20 degrees
Residue
iResidue
i+1Distance of hinge axis to residue i in
(A) Distance of hinge axis to residue i in
(A) Change in
(deg) Change in
(deg) Angle of psi(i) axis to hinge axis
(deg) Angle of psi(i) axis to hinge axis
(deg) Percentage Progress
ASN-121
PHE-122
11.0
10.0
22.1
-16.0
83.5
80.6
71.3
PHE-122
ILE-123
7.3
6.3
-18.8
18.4
123.6
124.7
56.8
ILE-123
GLY-124
4.6
4.2
-11.6
11.1
81.9
90.3
-31.4
GLY-124
THR-125
0.8
0.4
10.5
-0.8
35.9
30.7
54.5
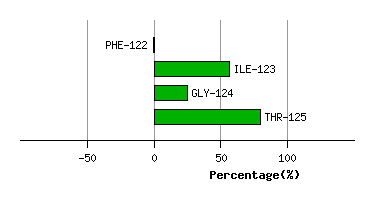
Graph shows rotational transition at bending residues and can be used
to identify hinge bending residues.
Probably only informative for interdomain rotations greater than 20 degrees
Residue
iResidue
i+1Distance of hinge axis to residue i in
(A) Distance of hinge axis to residue i in
(A) Change in
(deg) Change in
(deg) Angle of psi(i) axis to hinge axis
(deg) Angle of psi(i) axis to hinge axis
(deg) Percentage Progress
GLY-126
VAL-127
4.3
4.4
-3.2
0.9
20.8
21.5
13.2
VAL-127
SER-128
5.1
5.2
-5.7
7.7
74.5
72.5
-18.4
SER-128
GLY-129
8.1
8.1
2.6
-11.5
164.9
162.5
80.3
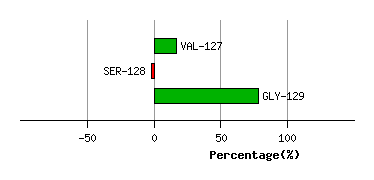
Graph shows rotational transition at bending residues and can be used
to identify hinge bending residues.
Probably only informative for interdomain rotations greater than 20 degrees
Residue
iResidue
i+1Distance of hinge axis to residue i in
(A) Distance of hinge axis to residue i in
(A) Change in
(deg) Change in
(deg) Angle of psi(i) axis to hinge axis
(deg) Angle of psi(i) axis to hinge axis
(deg) Percentage Progress
LYS-136
GLY-137
7.2
7.3
-6.1
1.5
76.2
79.6
-16.9
GLY-137
PRO-138
4.3
4.3
-11.8
5.6
51.8
52.2
39.8
PRO-138
SER-139
5.1
4.9
1.7
-8.7
101.6
100.7
-0.8
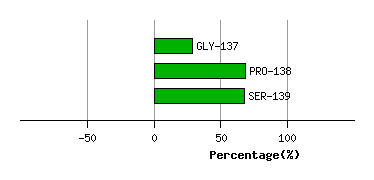
Graph shows rotational transition at bending residues and can be used
to identify hinge bending residues.
Probably only informative for interdomain rotations greater than 20 degrees
Residue
iResidue
i+1Distance of hinge axis to residue i in
(A) Distance of hinge axis to residue i in
(A) Change in
(deg) Change in
(deg) Angle of psi(i) axis to hinge axis
(deg) Angle of psi(i) axis to hinge axis
(deg) Percentage Progress
GLY-144
GLN-145
6.8
6.7
10.2
1.8
94.6
97.4
21.0
GLN-145
LYS-146
10.4
10.1
-16.4
-2.0
14.6
15.6
174.4
LYS-146
GLU-147
12.2
11.8
-4.1
0.5
72.8
65.4
28.9
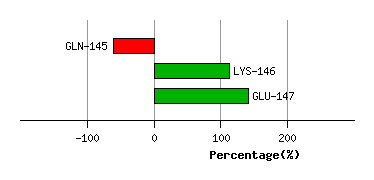
Graph shows rotational transition at bending residues and can be used
to identify hinge bending residues.
Probably only informative for interdomain rotations greater than 20 degrees
Residue
iResidue
i+1Distance of hinge axis to residue i in
(A) Distance of hinge axis to residue i in
(A) Change in
(deg) Change in
(deg) Angle of psi(i) axis to hinge axis
(deg) Angle of psi(i) axis to hinge axis
(deg) Percentage Progress
VAL-152
ALA-153
9.1
10.2
3.6
-2.6
41.2
42.8
19.1
ALA-153
PRO-154
8.5
8.9
10.4
-4.3
24.5
19.3
79.8
PRO-154
ILE-155
9.8
10.2
14.5
-3.6
77.8
78.5
45.5
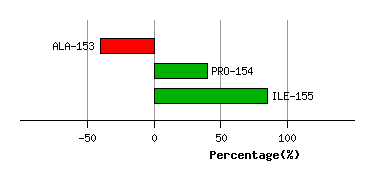
Graph shows rotational transition at bending residues and can be used
to identify hinge bending residues.
Probably only informative for interdomain rotations greater than 20 degrees
Residue
iResidue
i+1Distance of hinge axis to residue i in
(A) Distance of hinge axis to residue i in
(A) Change in
(deg) Change in
(deg) Angle of psi(i) axis to hinge axis
(deg) Angle of psi(i) axis to hinge axis
(deg) Percentage Progress
LEU-156
THR-157
4.6
5.0
-5.6
0.7
34.1
36.2
50.1
THR-157
LYS-158
5.1
5.5
8.4
-18.8
140.5
145.1
60.1
LYS-158
ILE-159
5.5
5.4
8.7
4.0
92.6
86.8
-40.7
ILE-159
ALA-160
3.7
3.8
-2.9
0.0
87.2
85.9
31.5
ILE-159
ALA-160
3.7
3.8
-2.9
0.0
87.2
85.9
31.5
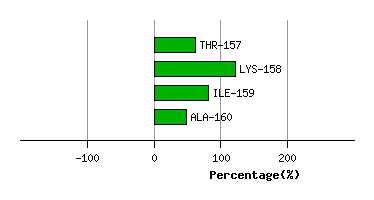
Graph shows rotational transition at bending residues and can be used
to identify hinge bending residues.
Probably only informative for interdomain rotations greater than 20 degrees
Residue
iResidue
i+1Distance of hinge axis to residue i in
(A) Distance of hinge axis to residue i in
(A) Change in
(deg) Change in
(deg) Angle of psi(i) axis to hinge axis
(deg) Angle of psi(i) axis to hinge axis
(deg) Percentage Progress
ILE-159
ALA-160
3.7
3.8
-2.9
0.0
87.2
85.9
31.5
ILE-159
ALA-160
3.7
3.8
-2.9
0.0
87.2
85.9
31.5
ALA-160
ALA-161
0.2
0.0
8.5
-10.7
28.5
29.6
-25.2
ALA-161
VAL-162
3.0
2.9
0.2
0.8
71.4
71.1
133.7
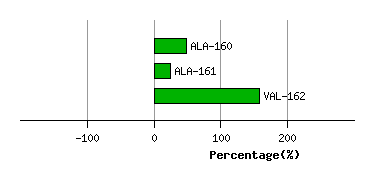
Graph shows rotational transition at bending residues and can be used
to identify hinge bending residues.
Probably only informative for interdomain rotations greater than 20 degrees