Serine/threonine-Protein Kinase Pak 4
(All numbering and residues are taken from first PDB file)
![]()
![]()
Bending Residue Dihedral Analysis
Residue
iResidue
i+1Distance of hinge axis to residue i in
(A) Distance of hinge axis to residue i in
(A) Change in
(deg) Change in
(deg) Angle of psi(i) axis to hinge axis
(deg) Angle of psi(i) axis to hinge axis
(deg) Percentage Progress
GLY-315
ASP-316
7.6
9.0
23.5
5.6
33.4
32.2
112.8
ASP-316
PRO-317
9.2
9.8
32.9
-3.3
41.2
47.6
95.3
PRO-317
ARG-318
7.3
7.8
-19.1
21.0
143.1
136.2
-5.0
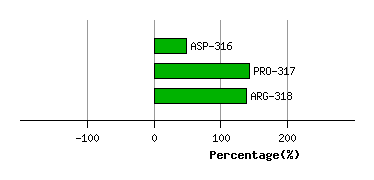
Graph shows rotational transition at bending residues and can be used
to identify hinge bending residues.
Probably only informative for interdomain rotations greater than 20 degrees
Residue
iResidue
i+1Distance of hinge axis to residue i in
(A) Distance of hinge axis to residue i in
(A) Change in
(deg) Change in
(deg) Angle of psi(i) axis to hinge axis
(deg) Angle of psi(i) axis to hinge axis
(deg) Percentage Progress
MET-352
ASP-353
12.6
12.4
18.5
-15.7
46.7
46.7
25.1
ASP-353
LEU-354
15.5
15.3
-7.7
3.9
137.2
127.7
7.1
LEU-354
ARG-355
16.0
15.4
-31.0
42.5
95.5
99.2
35.6
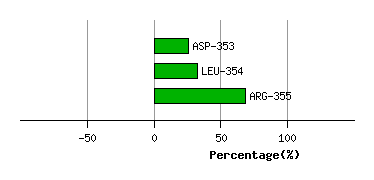
Graph shows rotational transition at bending residues and can be used
to identify hinge bending residues.
Probably only informative for interdomain rotations greater than 20 degrees
Residue
iResidue
i+1Distance of hinge axis to residue i in
(A) Distance of hinge axis to residue i in
(A) Change in
(deg) Change in
(deg) Angle of psi(i) axis to hinge axis
(deg) Angle of psi(i) axis to hinge axis
(deg) Percentage Progress
TYR-382
ASN-383
5.1
4.9
-0.6
-17.5
34.0
34.2
72.3
ASN-383
SER-384
2.1
2.0
5.9
-2.4
87.3
88.2
-12.2
SER-384
TYR-385
2.5
2.1
6.8
4.9
125.8
123.0
-35.6
TYR-385
LEU-386
4.6
4.6
-12.9
-18.9
87.6
79.5
-41.9
LEU-386
VAL-387
8.2
7.8
-9.2
13.1
107.6
80.6
-4.6
VAL-387
GLY-388
10.7
11.0
-3.0
10.4
91.0
82.1
17.3
GLY-388
ASP-389
14.2
13.8
-2.5
-7.7
79.5
98.8
-35.8
ASP-389
GLU-390
15.1
14.4
-3.2
19.5
124.1
152.0
38.2
GLU-390
LEU-391
12.3
12.4
-21.5
-18.0
67.7
80.7
63.1
LEU-391
TRP-392
9.4
9.2
10.8
-11.2
30.7
28.9
7.5
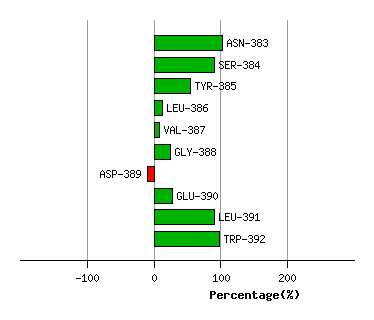
Graph shows rotational transition at bending residues and can be used
to identify hinge bending residues.
Probably only informative for interdomain rotations greater than 20 degrees
Residue
iResidue
i+1Distance of hinge axis to residue i in
(A) Distance of hinge axis to residue i in
(A) Change in
(deg) Change in
(deg) Angle of psi(i) axis to hinge axis
(deg) Angle of psi(i) axis to hinge axis
(deg) Percentage Progress
VAL-393
VAL-394
4.6
4.5
-2.9
-2.1
40.2
37.5
24.3
VAL-394
MET-395
1.5
1.6
2.0
11.2
102.1
101.9
29.4
MET-395
GLU-396
4.1
4.2
-6.6
-10.4
37.4
44.7
76.6
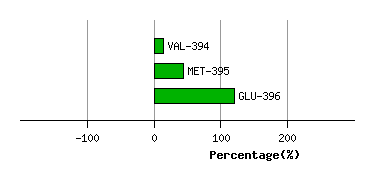
Graph shows rotational transition at bending residues and can be used
to identify hinge bending residues.
Probably only informative for interdomain rotations greater than 20 degrees