Beta-Catenin
(All numbering and residues are taken from first PDB file)
![]()
![]()
Bending Residue Dihedral Analysis
Residue
iResidue
i+1Distance of hinge axis to residue i in
(A) Distance of hinge axis to residue i in
(A) Change in
(deg) Change in
(deg) Angle of psi(i) axis to hinge axis
(deg) Angle of psi(i) axis to hinge axis
(deg) Percentage Progress
ASN-220
LEU-221
11.7
11.4
-1.8
3.9
127.7
124.7
109.7
LEU-221
SER-222
10.7
10.6
9.4
-5.1
109.1
114.1
35.8
SER-222
HIS-223
8.1
8.1
-10.3
6.1
50.4
49.5
78.3
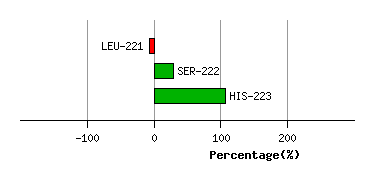
Graph shows rotational transition at bending residues and can be used
to identify hinge bending residues.
Probably only informative for interdomain rotations greater than 20 degrees
Residue
iResidue
i+1Distance of hinge axis to residue i in
(A) Distance of hinge axis to residue i in
(A) Change in
(deg) Change in
(deg) Angle of psi(i) axis to hinge axis
(deg) Angle of psi(i) axis to hinge axis
(deg) Percentage Progress
HIS-224
ARG-225
13.0
13.0
-2.7
9.7
57.0
55.1
-189.8
ARG-225
GLU-226
12.6
13.1
-21.2
5.5
19.9
24.0
430.9
GLU-226
GLY-227
12.4
12.9
9.1
-6.4
88.5
90.4
-22.3
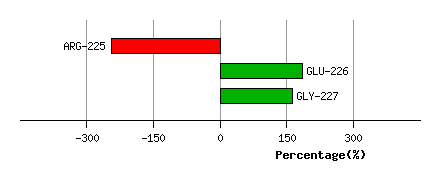
Graph shows rotational transition at bending residues and can be used
to identify hinge bending residues.
Probably only informative for interdomain rotations greater than 20 degrees
Residue
iResidue
i+1Distance of hinge axis to residue i in
(A) Distance of hinge axis to residue i in
(A) Change in
(deg) Change in
(deg) Angle of psi(i) axis to hinge axis
(deg) Angle of psi(i) axis to hinge axis
(deg) Percentage Progress
LEU-228
LEU-229
7.7
7.8
15.1
-4.2
25.9
27.3
237.1
LEU-229
ALA-230
8.5
8.7
-10.0
6.3
130.8
130.0
-147.5
ALA-230
ILE-231
7.5
7.6
19.4
-17.8
101.1
100.1
25.5
ILE-231
PHE-232
4.5
4.5
-8.7
8.5
104.5
105.9
-15.8
PHE-232
LYS-233
3.9
4.1
17.8
-11.9
12.8
9.5
138.0
LYS-233
SER-234
4.6
4.6
-13.4
10.5
115.7
112.9
-10.0
SER-234
GLY-235
2.2
2.5
2.1
-6.2
110.8
112.9
44.4
GLY-235
GLY-236
1.2
1.0
3.2
5.3
140.3
140.2
-126.0
GLY-236
ILE-237
1.9
1.7
-0.7
1.3
137.3
131.1
-28.2
GLY-236
ILE-237
1.9
1.7
-0.7
1.3
137.3
131.1
-28.2
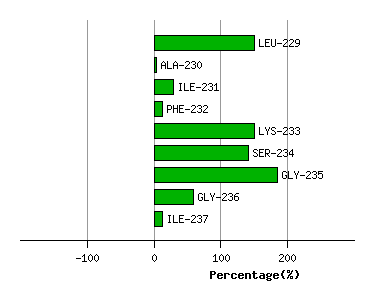
Graph shows rotational transition at bending residues and can be used
to identify hinge bending residues.
Probably only informative for interdomain rotations greater than 20 degrees
Residue
iResidue
i+1Distance of hinge axis to residue i in
(A) Distance of hinge axis to residue i in
(A) Change in
(deg) Change in
(deg) Angle of psi(i) axis to hinge axis
(deg) Angle of psi(i) axis to hinge axis
(deg) Percentage Progress
GLY-236
ILE-237
1.9
1.7
-0.7
1.3
137.3
131.1
-28.2
GLY-236
ILE-237
1.9
1.7
-0.7
1.3
137.3
131.1
-28.2
ILE-237
PRO-238
2.4
2.5
-3.3
0.2
86.9
85.4
23.1
PRO-238
ALA-239
5.8
5.8
7.4
-9.2
77.2
76.7
9.0
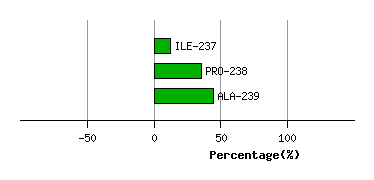
Graph shows rotational transition at bending residues and can be used
to identify hinge bending residues.
Probably only informative for interdomain rotations greater than 20 degrees
Residue
iResidue
i+1Distance of hinge axis to residue i in
(A) Distance of hinge axis to residue i in
(A) Change in
(deg) Change in
(deg) Angle of psi(i) axis to hinge axis
(deg) Angle of psi(i) axis to hinge axis
(deg) Percentage Progress
PHE-253
TYR-254
7.7
7.7
4.2
-1.4
46.3
48.5
5.7
TYR-254
ALA-255
7.4
7.5
11.4
-13.8
61.6
60.5
21.0
ALA-255
ILE-256
5.5
5.4
8.6
-6.6
119.2
119.1
-37.9
ILE-256
THR-257
3.4
3.3
3.6
-1.6
99.2
101.3
32.8
THR-257
THR-258
3.0
3.0
2.2
-6.9
34.6
34.8
-152.8
THR-257
THR-258
3.0
3.0
2.2
-6.9
34.6
34.8
-152.8
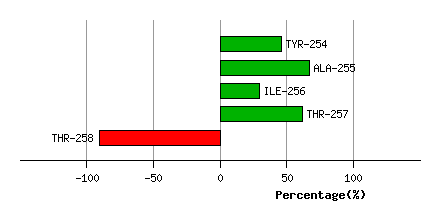
Graph shows rotational transition at bending residues and can be used
to identify hinge bending residues.
Probably only informative for interdomain rotations greater than 20 degrees
Residue
iResidue
i+1Distance of hinge axis to residue i in
(A) Distance of hinge axis to residue i in
(A) Change in
(deg) Change in
(deg) Angle of psi(i) axis to hinge axis
(deg) Angle of psi(i) axis to hinge axis
(deg) Percentage Progress
THR-257
THR-258
3.0
3.0
2.2
-6.9
34.6
34.8
-152.8
THR-257
THR-258
3.0
3.0
2.2
-6.9
34.6
34.8
-152.8
THR-258
LEU-259
3.3
3.3
10.1
-10.3
82.7
80.2
178.9
LEU-259
HIS-260
0.7
0.8
6.9
-6.9
128.9
130.2
18.6
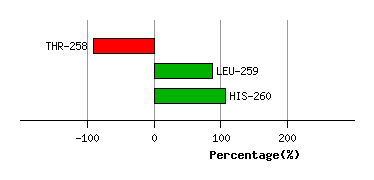
Graph shows rotational transition at bending residues and can be used
to identify hinge bending residues.
Probably only informative for interdomain rotations greater than 20 degrees
Residue
iResidue
i+1Distance of hinge axis to residue i in
(A) Distance of hinge axis to residue i in
(A) Change in
(deg) Change in
(deg) Angle of psi(i) axis to hinge axis
(deg) Angle of psi(i) axis to hinge axis
(deg) Percentage Progress
ASN-261
LEU-262
5.4
5.5
-1.0
1.4
39.3
39.9
24.0
LEU-262
LEU-263
5.1
5.3
-5.6
3.8
105.5
109.8
-8.2
LEU-263
LEU-264
6.7
6.7
10.0
-6.3
68.1
63.3
54.4
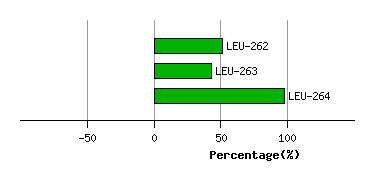
Graph shows rotational transition at bending residues and can be used
to identify hinge bending residues.
Probably only informative for interdomain rotations greater than 20 degrees
Residue
iResidue
i+1Distance of hinge axis to residue i in
(A) Distance of hinge axis to residue i in
(A) Change in
(deg) Change in
(deg) Angle of psi(i) axis to hinge axis
(deg) Angle of psi(i) axis to hinge axis
(deg) Percentage Progress
GLN-266
GLU-267
9.2
9.3
-12.8
4.8
105.0
104.7
-114.1
GLU-267
GLY-268
11.6
11.9
5.7
1.6
54.4
50.0
115.6
GLY-268
ALA-269
10.5
10.6
2.7
-4.7
109.8
108.7
34.4
ALA-269
LYS-270
7.4
7.6
-6.0
8.6
61.8
67.6
14.0
LYS-270
MET-271
9.6
9.8
9.0
-1.6
53.5
50.9
155.5
MET-271
ALA-272
11.5
11.6
-10.4
2.9
118.4
112.5
-187.0
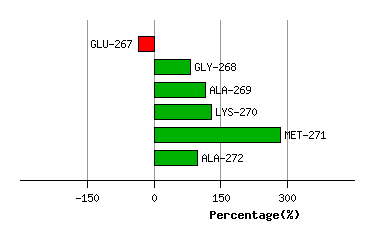
Graph shows rotational transition at bending residues and can be used
to identify hinge bending residues.
Probably only informative for interdomain rotations greater than 20 degrees