Proton-Gated Ion Channel
(All numbering and residues are taken from first PDB file)
![]()
![]()
Bending Residue Dihedral Analysis
Residue
iResidue
i+1Distance of hinge axis to residue i in
(A) Distance of hinge axis to residue i in
(A) Change in
(deg) Change in
(deg) Angle of psi(i) axis to hinge axis
(deg) Angle of psi(i) axis to hinge axis
(deg) Percentage Progress
PRO-7
PRO-8
4.6
4.6
0.3
-2.0
83.1
84.5
-14.8
PRO-8
PRO-9
7.5
7.4
4.7
-2.4
40.0
41.9
33.7
PRO-9
PRO-10
8.9
9.0
1.0
-1.1
105.0
106.1
-0.9
PRO-10
ILE-11
10.5
10.5
0.6
-0.5
70.1
72.5
7.3
ILE-11
ALA-12
14.3
14.3
1.1
-2.4
45.1
45.3
-13.5
ALA-12
ASP-13
15.1
15.0
-8.1
7.4
117.1
117.0
-0.2
ASP-13
GLU-14
12.5
12.6
-3.7
-0.8
38.8
43.0
96.3
GLU-14
PRO-15
12.4
12.3
5.7
-1.0
105.7
104.4
-36.9
PRO-15
LEU-16
9.6
9.4
3.8
-1.0
141.9
141.4
-33.0
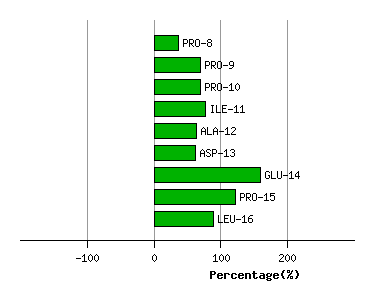
Graph shows rotational transition at bending residues and can be used
to identify hinge bending residues.
Probably only informative for interdomain rotations greater than 20 degrees
Residue
iResidue
i+1Distance of hinge axis to residue i in
(A) Distance of hinge axis to residue i in
(A) Change in
(deg) Change in
(deg) Angle of psi(i) axis to hinge axis
(deg) Angle of psi(i) axis to hinge axis
(deg) Percentage Progress
PHE-42
LEU-43
4.1
4.2
-1.3
-0.3
36.5
35.8
32.0
LEU-43
SER-44
3.5
3.6
-3.1
2.5
74.9
74.4
-1.4
SER-44
LEU-45
0.9
0.7
1.2
-2.0
156.6
156.7
-6.9
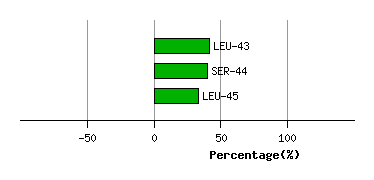
Graph shows rotational transition at bending residues and can be used
to identify hinge bending residues.
Probably only informative for interdomain rotations greater than 20 degrees
Residue
iResidue
i+1Distance of hinge axis to residue i in
(A) Distance of hinge axis to residue i in
(A) Change in
(deg) Change in
(deg) Angle of psi(i) axis to hinge axis
(deg) Angle of psi(i) axis to hinge axis
(deg) Percentage Progress
PRO-74
GLU-75
1.8
2.0
-0.5
-0.7
71.5
71.9
19.0
GLU-75
ILE-76
5.2
5.4
-0.8
0.0
63.8
63.4
9.1
ILE-76
ARG-77
5.8
5.9
-0.4
0.0
71.8
71.5
-1.2
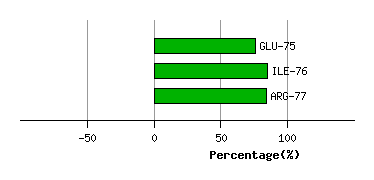
Graph shows rotational transition at bending residues and can be used
to identify hinge bending residues.
Probably only informative for interdomain rotations greater than 20 degrees
Residue
iResidue
i+1Distance of hinge axis to residue i in
(A) Distance of hinge axis to residue i in
(A) Change in
(deg) Change in
(deg) Angle of psi(i) axis to hinge axis
(deg) Angle of psi(i) axis to hinge axis
(deg) Percentage Progress
ALA-87
ASP-88
11.2
11.3
-0.5
-0.7
94.6
95.8
15.5
ASP-88
VAL-89
11.1
11.2
-1.1
0.2
89.4
89.9
-20.2
VAL-89
VAL-90
9.1
9.3
-2.7
3.1
144.5
145.1
-8.6
VAL-90
ASP-91
8.6
8.7
3.3
0.0
104.7
107.0
-11.5
ASP-91
ILE-92
8.8
8.8
-0.7
-0.4
32.1
27.6
36.7
ILE-92
SER-93
9.0
9.1
-15.4
17.1
95.7
94.4
-8.2
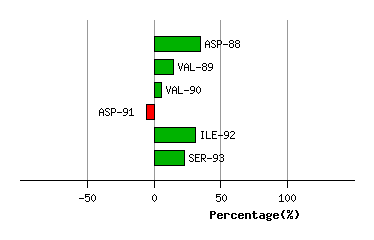
Graph shows rotational transition at bending residues and can be used
to identify hinge bending residues.
Probably only informative for interdomain rotations greater than 20 degrees
Residue
iResidue
i+1Distance of hinge axis to residue i in
(A) Distance of hinge axis to residue i in
(A) Change in
(deg) Change in
(deg) Angle of psi(i) axis to hinge axis
(deg) Angle of psi(i) axis to hinge axis
(deg) Percentage Progress
TYR-102
LEU-103
4.5
4.6
-5.0
5.0
37.7
38.1
8.3
LEU-103
GLU-104
3.7
3.9
-1.9
2.2
87.9
87.5
6.1
GLU-104
ARG-105
5.6
5.7
0.0
-0.2
43.3
43.2
11.5
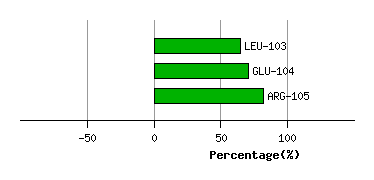
Graph shows rotational transition at bending residues and can be used
to identify hinge bending residues.
Probably only informative for interdomain rotations greater than 20 degrees