Udp-Galactose 4-Epimerase
(All numbering and residues are taken from first PDB file)
![]()
![]()
Bending Residue Dihedral Analysis
Residue
iResidue
i+1Distance of hinge axis to residue i in
(A) Distance of hinge axis to residue i in
(A) Change in
(deg) Change in
(deg) Angle of psi(i) axis to hinge axis
(deg) Angle of psi(i) axis to hinge axis
(deg) Percentage Progress
GLU-199
ASP-200
16.1
16.6
-2.8
46.2
139.9
140.9
330.3
ASP-200
PRO-201
18.6
18.6
87.9
7.9
106.0
100.1
-314.6
PRO-201
GLN-202
18.9
17.9
-19.1
5.2
133.4
51.2
-66.8
GLN-202
GLY-203
21.9
19.5
18.5
-135.0
91.8
80.5
-197.4
GLY-203
ILE-204
21.7
21.9
105.4
-58.5
104.4
117.7
-112.9
ILE-204
PRO-205
19.4
20.3
-38.3
23.2
33.0
63.5
103.3
PRO-205
ASN-206
16.9
16.7
11.1
-7.1
135.3
157.9
-26.7
ASN-206
ASN-207
16.8
15.3
6.0
-53.6
109.7
91.3
46.2
ASN-207
LEU-208
13.2
12.0
26.3
-12.9
46.4
27.4
109.0
LEU-208
MET-209
10.4
10.2
19.7
4.9
41.7
37.6
292.6
MET-209
PRO-210
8.4
8.2
7.4
4.9
34.2
33.6
-37.3
PRO-210
TYR-211
11.3
11.1
-3.4
-3.2
121.8
124.3
-38.2
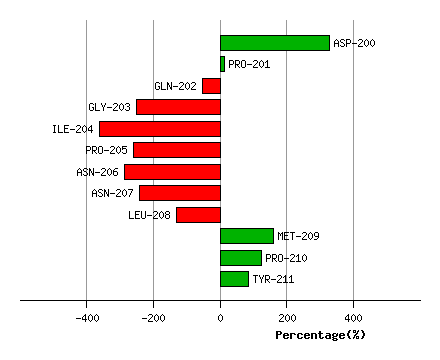
Graph shows rotational transition at bending residues and can be used
to identify hinge bending residues.
Probably only informative for interdomain rotations greater than 20 degrees
Residue
iResidue
i+1Distance of hinge axis to residue i in
(A) Distance of hinge axis to residue i in
(A) Change in
(deg) Change in
(deg) Angle of psi(i) axis to hinge axis
(deg) Angle of psi(i) axis to hinge axis
(deg) Percentage Progress
VAL-215
ALA-216
10.4
10.1
12.7
-11.0
131.8
128.0
23.6
ALA-216
ILE-217
6.9
6.6
4.6
-13.6
143.1
148.8
-22.7
ILE-217
GLY-218
8.9
8.4
13.3
-7.4
127.8
122.5
31.8
GLY-218
ARG-219
10.8
10.7
-21.6
17.8
94.3
99.1
17.6
ARG-219
ARG-220
14.1
13.6
29.0
-38.0
62.5
51.5
-45.9
ARG-220
GLU-221
14.6
14.2
-16.9
15.6
68.4
76.1
7.4
GLU-221
ALA-222
14.8
14.6
-24.1
17.1
55.5
54.4
-11.8
GLU-221
ALA-222
14.8
14.6
-24.1
17.1
55.5
54.4
-11.8
Graph shows rotational transition at bending residues and can be used
to identify hinge bending residues.
Probably only informative for interdomain rotations greater than 20 degrees
Residue
iResidue
i+1Distance of hinge axis to residue i in
(A) Distance of hinge axis to residue i in
(A) Change in
(deg) Change in
(deg) Angle of psi(i) axis to hinge axis
(deg) Angle of psi(i) axis to hinge axis
(deg) Percentage Progress
GLU-221
ALA-222
14.8
14.6
-24.1
17.1
55.5
54.4
-11.8
GLU-221
ALA-222
14.8
14.6
-24.1
17.1
55.5
54.4
-11.8
ALA-222
LEU-223
13.8
14.0
-12.4
2.4
22.9
21.4
49.1
LEU-223
ASN-224
13.1
13.1
9.5
-1.1
121.1
128.2
-17.1
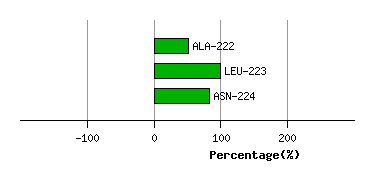
Graph shows rotational transition at bending residues and can be used
to identify hinge bending residues.
Probably only informative for interdomain rotations greater than 20 degrees
Residue
iResidue
i+1Distance of hinge axis to residue i in
(A) Distance of hinge axis to residue i in
(A) Change in
(deg) Change in
(deg) Angle of psi(i) axis to hinge axis
(deg) Angle of psi(i) axis to hinge axis
(deg) Percentage Progress
VAL-238
ARG-239
6.5
6.7
-12.4
15.6
111.8
108.9
30.1
ARG-239
ASP-240
4.7
5.5
-0.2
-6.5
85.9
90.0
3.3
ASP-240
TYR-241
3.1
4.3
20.6
-39.7
131.9
131.1
150.4
TYR-241
ILE-242
4.7
5.5
12.8
-5.7
84.1
83.6
-6.0
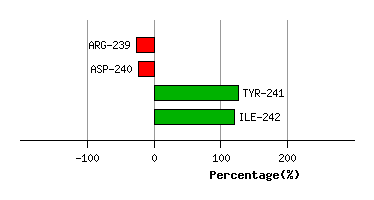
Graph shows rotational transition at bending residues and can be used
to identify hinge bending residues.
Probably only informative for interdomain rotations greater than 20 degrees
Residue
iResidue
i+1Distance of hinge axis to residue i in
(A) Distance of hinge axis to residue i in
(A) Change in
(deg) Change in
(deg) Angle of psi(i) axis to hinge axis
(deg) Angle of psi(i) axis to hinge axis
(deg) Percentage Progress
GLY-274
TYR-275
1.7
1.3
14.8
9.7
33.6
28.9
207.0
TYR-275
SER-276
3.1
2.6
-11.8
4.9
97.3
98.3
-5.9
SER-276
VAL-277
6.4
6.2
-6.9
-4.1
149.7
152.2
-92.0
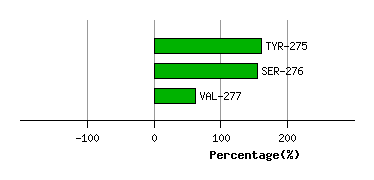
Graph shows rotational transition at bending residues and can be used
to identify hinge bending residues.
Probably only informative for interdomain rotations greater than 20 degrees
Residue
iResidue
i+1Distance of hinge axis to residue i in
(A) Distance of hinge axis to residue i in
(A) Change in
(deg) Change in
(deg) Angle of psi(i) axis to hinge axis
(deg) Angle of psi(i) axis to hinge axis
(deg) Percentage Progress
CYS-307
TYR-308
6.0
6.3
-12.3
4.9
72.6
73.4
45.0
TYR-308
ALA-309
2.7
3.1
6.3
-19.9
37.8
34.9
-105.6
ALA-309
ASN-310
3.7
3.7
-3.8
12.7
117.2
98.9
143.9
ASN-310
PRO-311
4.2
4.3
17.1
-13.5
95.2
89.5
34.5
PRO-311
SER-312
7.8
8.0
3.4
7.0
57.1
62.4
77.6
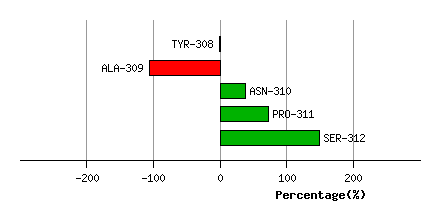
Graph shows rotational transition at bending residues and can be used
to identify hinge bending residues.
Probably only informative for interdomain rotations greater than 20 degrees