Udp-Glcnac C6 Dehydratase
(All numbering and residues are taken from first PDB file)
![]()
![]()
Bending Residue Dihedral Analysis
Residue
iResidue
i+1Distance of hinge axis to residue i in
(A) Distance of hinge axis to residue i in
(A) Change in
(deg) Change in
(deg) Angle of psi(i) axis to hinge axis
(deg) Angle of psi(i) axis to hinge axis
(deg) Percentage Progress
VAL-169
ARG-170
16.2
16.1
-0.4
4.0
113.7
114.4
10.8
ARG-170
TYR-171
12.6
12.5
-2.3
7.9
49.3
47.1
-127.5
TYR-171
GLY-172
9.6
9.5
1.7
30.6
61.9
66.1
196.5
GLY-172
ASN-173
7.2
6.4
-17.2
-25.7
64.9
85.5
259.1
ASN-173
VAL-174
7.3
7.2
3.0
18.0
153.0
150.6
-282.2
VAL-174
VAL-175
9.9
10.0
-9.6
5.7
70.9
70.7
47.0
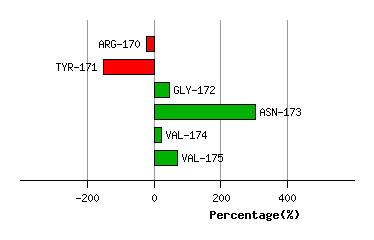
Graph shows rotational transition at bending residues and can be used
to identify hinge bending residues.
Probably only informative for interdomain rotations greater than 20 degrees
Residue
iResidue
i+1Distance of hinge axis to residue i in
(A) Distance of hinge axis to residue i in
(A) Change in
(deg) Change in
(deg) Angle of psi(i) axis to hinge axis
(deg) Angle of psi(i) axis to hinge axis
(deg) Percentage Progress
GLU-195
ILE-196
23.4
23.3
30.4
-12.7
93.4
94.7
-62.5
ILE-196
PRO-197
19.7
19.6
-4.2
-5.8
32.9
35.7
136.2
PRO-197
ILE-198
17.9
17.9
-8.9
18.5
96.9
97.8
-14.4
ILE-198
THR-199
15.0
14.9
-9.7
13.1
156.0
156.0
39.5
ILE-198
THR-199
15.0
14.9
-9.7
13.1
156.0
156.0
39.5
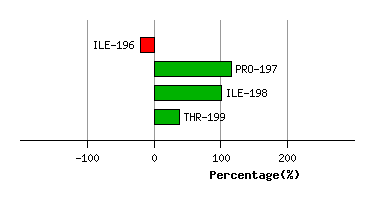
Graph shows rotational transition at bending residues and can be used
to identify hinge bending residues.
Probably only informative for interdomain rotations greater than 20 degrees
Residue
iResidue
i+1Distance of hinge axis to residue i in
(A) Distance of hinge axis to residue i in
(A) Change in
(deg) Change in
(deg) Angle of psi(i) axis to hinge axis
(deg) Angle of psi(i) axis to hinge axis
(deg) Percentage Progress
ILE-198
THR-199
15.0
14.9
-9.7
13.1
156.0
156.0
39.5
ILE-198
THR-199
15.0
14.9
-9.7
13.1
156.0
156.0
39.5
THR-199
ASP-200
12.7
12.7
14.0
-32.1
85.6
83.0
4.0
ASP-200
ILE-201
12.1
12.1
-43.5
48.2
22.0
23.9
-31.2
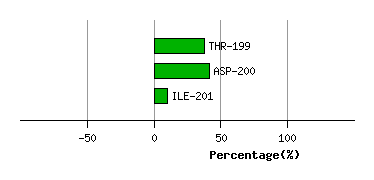
Graph shows rotational transition at bending residues and can be used
to identify hinge bending residues.
Probably only informative for interdomain rotations greater than 20 degrees
Residue
iResidue
i+1Distance of hinge axis to residue i in
(A) Distance of hinge axis to residue i in
(A) Change in
(deg) Change in
(deg) Angle of psi(i) axis to hinge axis
(deg) Angle of psi(i) axis to hinge axis
(deg) Percentage Progress
THR-204
ARG-205
5.1
4.7
-13.9
4.6
78.7
84.2
38.9
ARG-205
PHE-206
2.1
2.0
6.1
-12.9
36.0
35.1
-76.0
PHE-206
TRP-207
1.8
2.0
7.1
-3.7
66.0
67.8
52.6
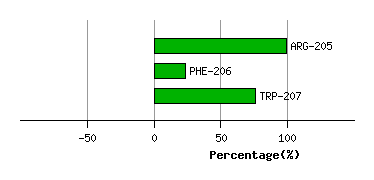
Graph shows rotational transition at bending residues and can be used
to identify hinge bending residues.
Probably only informative for interdomain rotations greater than 20 degrees
Residue
iResidue
i+1Distance of hinge axis to residue i in
(A) Distance of hinge axis to residue i in
(A) Change in
(deg) Change in
(deg) Angle of psi(i) axis to hinge axis
(deg) Angle of psi(i) axis to hinge axis
(deg) Percentage Progress
MET-237
LYS-238
4.1
4.2
-11.2
26.5
139.8
139.9
184.8
LYS-238
MET-239
7.4
7.4
-1.8
-3.0
87.9
91.4
-12.6
MET-239
THR-240
9.3
8.9
-9.0
1.3
66.2
67.9
36.7
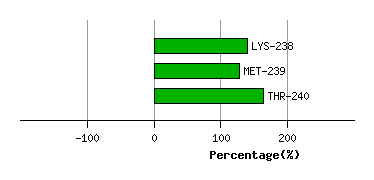
Graph shows rotational transition at bending residues and can be used
to identify hinge bending residues.
Probably only informative for interdomain rotations greater than 20 degrees
Residue
iResidue
i+1Distance of hinge axis to residue i in
(A) Distance of hinge axis to residue i in
(A) Change in
(deg) Change in
(deg) Angle of psi(i) axis to hinge axis
(deg) Angle of psi(i) axis to hinge axis
(deg) Percentage Progress
ALA-243
LYS-244
14.3
14.1
-40.9
45.4
136.5
137.7
110.2
LYS-244
ALA-245
15.2
15.3
27.1
-22.5
39.1
30.5
69.2
ALA-245
LEU-246
13.5
13.8
7.3
6.7
102.4
91.8
-66.2
LEU-246
ALA-247
14.9
15.6
-27.9
1.2
69.7
84.0
43.1
ALA-247
PRO-248
17.8
18.6
-14.9
-24.5
121.4
94.0
-280.7
PRO-248
ASN-249
19.3
19.0
62.5
52.8
117.7
106.2
-793.1
ASN-249
THR-250
21.9
22.8
-165.5
95.1
39.0
9.1
1100.1
ASN-249
THR-250
21.9
22.8
-165.5
95.1
39.0
9.1
1100.1
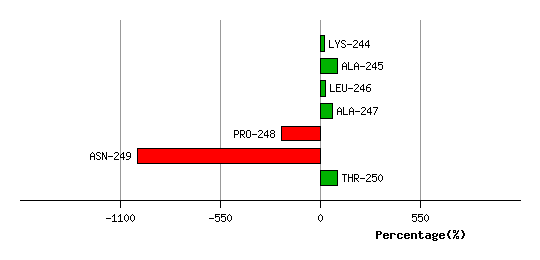
Graph shows rotational transition at bending residues and can be used
to identify hinge bending residues.
Probably only informative for interdomain rotations greater than 20 degrees
Residue
iResidue
i+1Distance of hinge axis to residue i in
(A) Distance of hinge axis to residue i in
(A) Change in
(deg) Change in
(deg) Angle of psi(i) axis to hinge axis
(deg) Angle of psi(i) axis to hinge axis
(deg) Percentage Progress
ASN-249
THR-250
21.9
22.8
-165.5
95.1
39.0
9.1
1100.1
ASN-249
THR-250
21.9
22.8
-165.5
95.1
39.0
9.1
1100.1
THR-250
PRO-251
22.7
23.3
-6.5
-13.1
40.6
58.3
192.0
PRO-251
THR-252
23.0
22.6
-2.4
24.2
53.3
47.6
-238.0
THR-252
LYS-253
20.5
19.9
1.9
-4.4
158.6
155.0
34.2
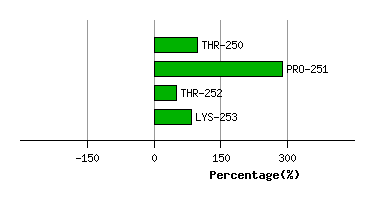
Graph shows rotational transition at bending residues and can be used
to identify hinge bending residues.
Probably only informative for interdomain rotations greater than 20 degrees
Residue
iResidue
i+1Distance of hinge axis to residue i in
(A) Distance of hinge axis to residue i in
(A) Change in
(deg) Change in
(deg) Angle of psi(i) axis to hinge axis
(deg) Angle of psi(i) axis to hinge axis
(deg) Percentage Progress
PRO-326
ASP-327
9.9
8.9
36.7
-45.5
140.9
137.1
192.4
ASP-327
ASP-328
9.8
9.4
-3.0
-1.6
88.1
79.2
85.1
ASP-328
LEU-329
6.5
6.2
22.0
-17.9
56.7
46.9
14.1
LEU-329
LEU-330
8.3
7.6
14.6
-9.1
62.5
74.2
22.6
LEU-329
LEU-330
8.3
7.6
14.6
-9.1
62.5
74.2
22.6
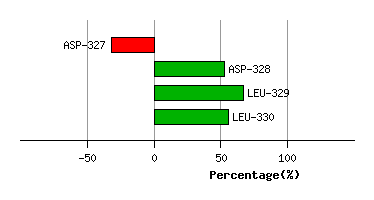
Graph shows rotational transition at bending residues and can be used
to identify hinge bending residues.
Probably only informative for interdomain rotations greater than 20 degrees
Residue
iResidue
i+1Distance of hinge axis to residue i in
(A) Distance of hinge axis to residue i in
(A) Change in
(deg) Change in
(deg) Angle of psi(i) axis to hinge axis
(deg) Angle of psi(i) axis to hinge axis
(deg) Percentage Progress
LEU-329
LEU-330
8.3
7.6
14.6
-9.1
62.5
74.2
22.6
LEU-329
LEU-330
8.3
7.6
14.6
-9.1
62.5
74.2
22.6
LEU-330
LYS-331
11.5
11.0
-2.5
0.1
127.9
126.1
-39.1
LYS-331
LEU-332
9.7
9.9
-34.2
59.4
63.7
58.1
-267.1
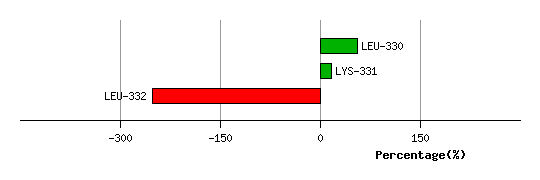
Graph shows rotational transition at bending residues and can be used
to identify hinge bending residues.
Probably only informative for interdomain rotations greater than 20 degrees