Glutamate Receptor, Ionotropic Kainate 1
(All numbering and residues are taken from first PDB file)
![]()
![]()
Bending Residue Dihedral Analysis
Residue
iResidue
i+1Distance of hinge axis to residue i in
(A) Distance of hinge axis to residue i in
(A) Change in
(deg) Change in
(deg) Angle of psi(i) axis to hinge axis
(deg) Angle of psi(i) axis to hinge axis
(deg) Percentage Progress
ILE-110
SER-111
1.1
1.2
0.2
1.0
42.2
40.9
5.3
SER-111
ILE-112
2.3
2.4
-7.4
8.3
131.1
133.5
-2.6
ILE-112
LEU-113
1.9
2.1
5.3
-11.8
36.8
38.5
-63.4
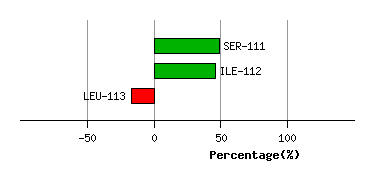
Graph shows rotational transition at bending residues and can be used
to identify hinge bending residues.
Probably only informative for interdomain rotations greater than 20 degrees
Residue
iResidue
i+1Distance of hinge axis to residue i in
(A) Distance of hinge axis to residue i in
(A) Change in
(deg) Change in
(deg) Angle of psi(i) axis to hinge axis
(deg) Angle of psi(i) axis to hinge axis
(deg) Percentage Progress
LEU-188
MET-189
4.1
3.8
13.4
-23.3
72.8
65.3
-6.6
MET-189
GLU-190
3.3
3.3
20.2
3.1
62.4
69.4
105.3
GLU-190
SER-191
4.0
4.3
-16.7
1.6
48.0
45.7
107.3
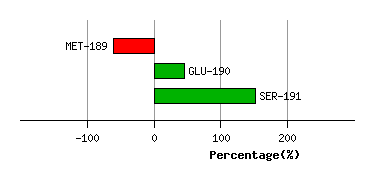
Graph shows rotational transition at bending residues and can be used
to identify hinge bending residues.
Probably only informative for interdomain rotations greater than 20 degrees
Residue
iResidue
i+1Distance of hinge axis to residue i in
(A) Distance of hinge axis to residue i in
(A) Change in
(deg) Change in
(deg) Angle of psi(i) axis to hinge axis
(deg) Angle of psi(i) axis to hinge axis
(deg) Percentage Progress
LEU-204
THR-205
2.8
2.8
0.7
2.8
119.9
115.9
-11.7
THR-205
GLN-206
3.7
3.8
-5.9
1.0
25.2
23.4
28.8
GLN-206
ILE-207
4.1
4.2
1.2
-0.6
83.4
84.4
11.6
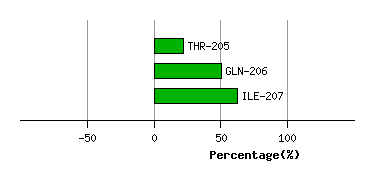
Graph shows rotational transition at bending residues and can be used
to identify hinge bending residues.
Probably only informative for interdomain rotations greater than 20 degrees
Residue
iResidue
i+1Distance of hinge axis to residue i in
(A) Distance of hinge axis to residue i in
(A) Change in
(deg) Change in
(deg) Angle of psi(i) axis to hinge axis
(deg) Angle of psi(i) axis to hinge axis
(deg) Percentage Progress
GLY-208
GLY-209
8.1
8.3
3.2
-1.8
55.4
54.1
32.9
GLY-209
LEU-210
8.4
8.6
5.2
1.3
51.5
50.1
108.2
LEU-210
ILE-211
6.4
6.7
-4.1
-3.2
127.5
122.3
-68.5
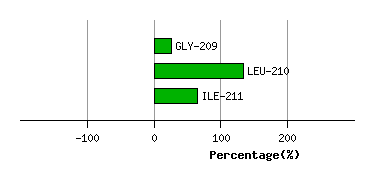
Graph shows rotational transition at bending residues and can be used
to identify hinge bending residues.
Probably only informative for interdomain rotations greater than 20 degrees