Shikimate Kinase
(All numbering and residues are taken from first PDB file)
![]()
![]()
Bending Residue Dihedral Analysis
Residue
iResidue
i+1Distance of hinge axis to residue i in
(A) Distance of hinge axis to residue i in
(A) Change in
(deg) Change in
(deg) Angle of psi(i) axis to hinge axis
(deg) Angle of psi(i) axis to hinge axis
(deg) Percentage Progress
VAL-98
TYR-99
3.3
2.9
0.6
6.4
89.0
81.3
-7.0
TYR-99
LEU-100
2.4
2.5
1.8
-6.0
156.9
157.2
19.3
LEU-100
GLU-101
2.9
3.3
15.7
2.6
84.6
79.8
54.6
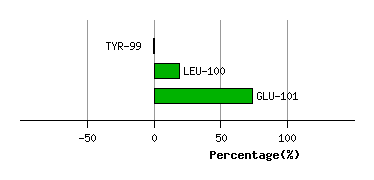
Graph shows rotational transition at bending residues and can be used
to identify hinge bending residues.
Probably only informative for interdomain rotations greater than 20 degrees
Residue
iResidue
i+1Distance of hinge axis to residue i in
(A) Distance of hinge axis to residue i in
(A) Change in
(deg) Change in
(deg) Angle of psi(i) axis to hinge axis
(deg) Angle of psi(i) axis to hinge axis
(deg) Percentage Progress
GLY-113
ASN-114
20.2
21.4
-158.4
5.1
85.9
40.7
647.6
ASN-114
THR-115
20.4
23.6
-98.7
85.3
80.7
44.1
21.5
THR-115
VAL-116
18.0
21.1
145.6
72.0
117.4
150.2
-469.0
LEU-119
LEU-120
19.5
18.8
23.2
-5.1
42.4
34.4
79.9
LEU-120
ALA-121
20.6
19.7
-1.7
19.9
124.8
119.2
13.2
ALA-121
GLY-122
24.2
23.3
-19.8
-175.6
70.8
93.9
14.2
GLY-122
PRO-123
27.7
26.1
-14.7
-9.0
118.4
48.3
6.7
PRO-123
ASP-124
29.3
28.0
-165.2
162.8
79.4
71.6
-27.1
ASP-124
ARG-125
26.9
26.1
16.0
6.8
77.6
94.9
-35.4
ARG-125
ALA-126
23.7
22.7
-1.4
-2.5
108.3
97.6
3.6
ALA-126
GLU-127
22.8
21.6
9.1
1.7
140.7
147.4
-32.2
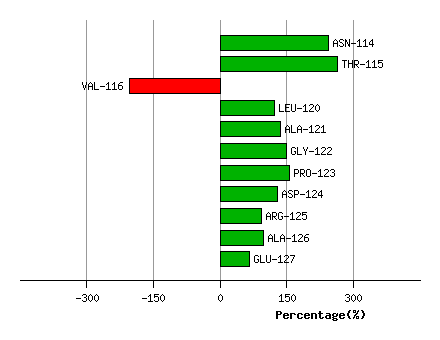
Graph shows rotational transition at bending residues and can be used
to identify hinge bending residues.
Probably only informative for interdomain rotations greater than 20 degrees
Residue
iResidue
i+1Distance of hinge axis to residue i in
(A) Distance of hinge axis to residue i in
(A) Change in
(deg) Change in
(deg) Angle of psi(i) axis to hinge axis
(deg) Angle of psi(i) axis to hinge axis
(deg) Percentage Progress
ALA-144
THR-145
5.0
4.8
4.3
0.6
87.1
97.3
-39.2
THR-145
MET-146
7.8
7.8
2.5
-14.1
166.0
164.3
62.6
MET-146
ARG-147
7.3
7.1
15.3
-12.8
101.3
97.7
3.5
ARG-147
VAL-148
6.7
6.1
7.4
-14.4
179.4
174.0
51.0
VAL-148
ASP-149
5.5
5.0
26.3
-23.3
106.2
101.7
-29.9
ASP-149
THR-150
7.6
6.6
13.3
0.5
133.3
128.5
-58.6
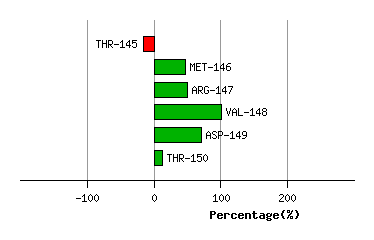
Graph shows rotational transition at bending residues and can be used
to identify hinge bending residues.
Probably only informative for interdomain rotations greater than 20 degrees
Residue
iResidue
i+1Distance of hinge axis to residue i in
(A) Distance of hinge axis to residue i in
(A) Change in
(deg) Change in
(deg) Angle of psi(i) axis to hinge axis
(deg) Angle of psi(i) axis to hinge axis
(deg) Percentage Progress
GLY-156
ALA-157
2.9
3.1
12.3
-13.3
101.8
95.5
-1.2
ALA-157
VAL-158
2.3
1.9
-20.1
19.6
13.0
16.6
-6.6
VAL-158
VAL-159
1.8
2.0
7.6
-1.5
104.6
111.0
-6.0
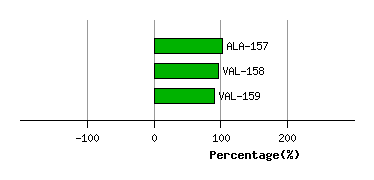
Graph shows rotational transition at bending residues and can be used
to identify hinge bending residues.
Probably only informative for interdomain rotations greater than 20 degrees