Alcohol Dehydrogenase E Chain
(All numbering and residues are taken from first PDB file)
![]()
![]()
Bending Residue Dihedral Analysis
Residue
iResidue
i+1Distance of hinge axis to residue i in
(A) Distance of hinge axis to residue i in
(A) Change in
(deg) Change in
(deg) Angle of psi(i) axis to hinge axis
(deg) Angle of psi(i) axis to hinge axis
(deg) Percentage Progress
GLY-179
TYR-180
4.4
4.8
-56.5
40.0
108.2
106.6
22.4
TYR-180
GLY-181
5.2
5.5
6.0
-10.6
24.2
33.3
-70.8
GLY-181
SER-182
3.6
3.9
19.8
-14.4
42.3
29.8
84.2
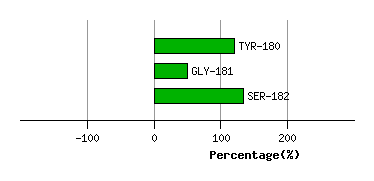
Graph shows rotational transition at bending residues and can be used
to identify hinge bending residues.
Probably only informative for interdomain rotations greater than 20 degrees
Residue
iResidue
i+1Distance of hinge axis to residue i in
(A) Distance of hinge axis to residue i in
(A) Change in
(deg) Change in
(deg) Angle of psi(i) axis to hinge axis
(deg) Angle of psi(i) axis to hinge axis
(deg) Percentage Progress
ILE-291
VAL-292
9.3
9.1
-7.3
36.6
132.2
136.8
321.1
VAL-292
GLY-293
8.1
7.6
-33.4
-39.9
118.5
107.7
-428.1
GLY-293
VAL-294
11.4
10.1
-9.2
-52.4
65.7
54.4
413.5
VAL-294
PRO-295
13.4
13.0
-11.1
49.8
87.0
111.3
82.9
PRO-295
PRO-296
17.0
16.2
-42.6
-17.8
98.8
51.7
149.1
PRO-296
ASP-297
20.3
17.4
-154.6
-43.7
43.5
71.5
-1375.1
ASP-297
SER-298
20.8
20.7
-51.2
142.9
36.1
54.6
2125.6
SER-298
GLN-299
21.8
20.7
145.8
1.0
112.7
160.9
-983.9
GLN-299
ASN-300
22.0
22.0
19.5
55.2
132.2
113.1
-516.8
ASN-300
LEU-301
20.8
19.3
135.3
-131.2
85.2
76.6
250.6
LEU-301
SER-302
20.2
19.8
-15.3
31.1
18.6
18.3
-167.5
SER-302
MET-303
21.6
21.7
-9.7
-11.1
82.6
68.0
54.4
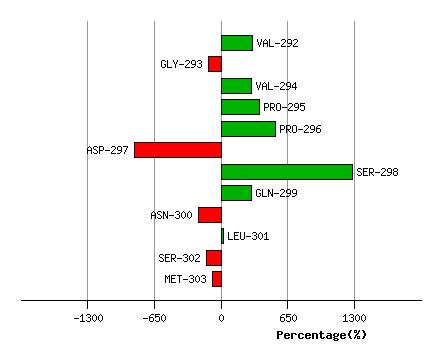
Graph shows rotational transition at bending residues and can be used
to identify hinge bending residues.
Probably only informative for interdomain rotations greater than 20 degrees
Residue
iResidue
i+1Distance of hinge axis to residue i in
(A) Distance of hinge axis to residue i in
(A) Change in
(deg) Change in
(deg) Angle of psi(i) axis to hinge axis
(deg) Angle of psi(i) axis to hinge axis
(deg) Percentage Progress
ARG-312
THR-313
12.4
12.2
-4.8
4.4
91.2
102.5
-13.3
THR-313
TRP-314
8.9
8.9
-2.3
12.2
144.4
144.4
112.6
TRP-314
LYS-315
8.8
8.6
-3.9
29.0
103.8
99.4
219.2
LYS-315
GLY-316
6.0
5.3
53.8
-79.7
25.2
53.0
-214.2
GLY-316
ALA-317
6.1
5.2
-27.5
1.4
108.1
107.7
-47.1
ALA-317
ILE-318
4.3
3.3
-17.9
6.6
151.5
153.9
-61.6
ILE-318
PHE-319
5.6
5.1
-9.9
3.7
120.1
119.4
83.2
PHE-319
GLY-320
3.8
3.7
51.6
-57.3
109.4
115.8
44.1
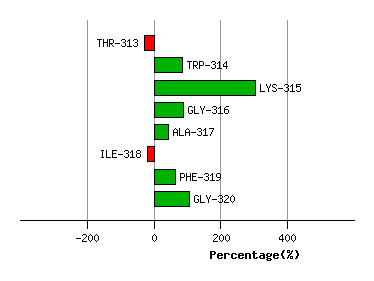
Graph shows rotational transition at bending residues and can be used
to identify hinge bending residues.
Probably only informative for interdomain rotations greater than 20 degrees