O-Acetylserine Sulfhydrylase
(All numbering and residues are taken from first PDB file)
![]()
![]()
Bending Residue Dihedral Analysis
Residue
iResidue
i+1Distance of hinge axis to residue i in
(A) Distance of hinge axis to residue i in
(A) Change in
(deg) Change in
(deg) Angle of psi(i) axis to hinge axis
(deg) Angle of psi(i) axis to hinge axis
(deg) Percentage Progress
LYS-86
LEU-87
5.0
4.9
-2.8
3.1
79.9
81.8
-37.4
LEU-87
THR-88
1.4
1.4
-1.0
2.7
127.0
123.6
-28.3
THR-88
LEU-89
2.2
2.3
-9.0
8.4
87.8
91.4
18.6
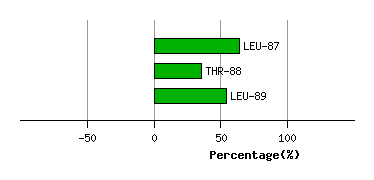
Graph shows rotational transition at bending residues and can be used
to identify hinge bending residues.
Probably only informative for interdomain rotations greater than 20 degrees
Residue
iResidue
i+1Distance of hinge axis to residue i in
(A) Distance of hinge axis to residue i in
(A) Change in
(deg) Change in
(deg) Angle of psi(i) axis to hinge axis
(deg) Angle of psi(i) axis to hinge axis
(deg) Percentage Progress
LYS-101
LEU-102
4.1
4.0
-1.2
0.6
121.1
124.4
85.8
LEU-102
LEU-103
7.0
6.8
-4.7
2.2
151.9
152.2
-24.5
LEU-103
LYS-104
5.1
5.0
6.2
-4.2
93.1
93.2
-46.4
LYS-104
ALA-105
2.2
2.2
-5.3
-1.4
78.9
78.1
63.7
ALA-105
LEU-106
5.6
5.7
6.5
-4.5
31.2
31.4
26.1
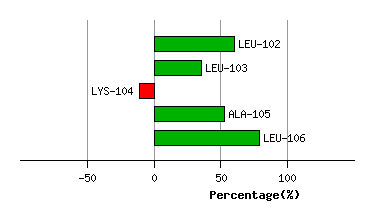
Graph shows rotational transition at bending residues and can be used
to identify hinge bending residues.
Probably only informative for interdomain rotations greater than 20 degrees
Residue
iResidue
i+1Distance of hinge axis to residue i in
(A) Distance of hinge axis to residue i in
(A) Change in
(deg) Change in
(deg) Angle of psi(i) axis to hinge axis
(deg) Angle of psi(i) axis to hinge axis
(deg) Percentage Progress
LYS-125
ALA-126
12.8
12.9
29.3
-32.9
58.8
66.9
-88.3
ALA-126
GLU-127
9.5
9.7
5.0
-4.5
19.3
16.4
0.7
GLU-127
GLU-128
11.1
10.9
11.5
-2.2
87.4
87.9
97.9
GLU-128
ILE-129
12.9
12.8
-8.5
6.7
94.1
90.7
-53.7
GLU-128
ILE-129
12.9
12.8
-8.5
6.7
94.1
90.7
-53.7
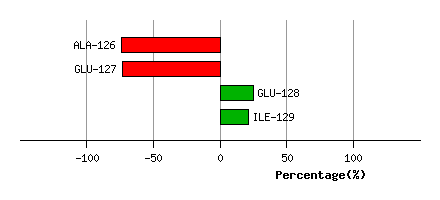
Graph shows rotational transition at bending residues and can be used
to identify hinge bending residues.
Probably only informative for interdomain rotations greater than 20 degrees
Residue
iResidue
i+1Distance of hinge axis to residue i in
(A) Distance of hinge axis to residue i in
(A) Change in
(deg) Change in
(deg) Angle of psi(i) axis to hinge axis
(deg) Angle of psi(i) axis to hinge axis
(deg) Percentage Progress
GLU-128
ILE-129
12.9
12.8
-8.5
6.7
94.1
90.7
-53.7
GLU-128
ILE-129
12.9
12.8
-8.5
6.7
94.1
90.7
-53.7
ILE-129
VAL-130
10.0
9.9
-5.3
4.8
30.4
31.2
-11.7
VAL-130
ALA-131
8.1
7.8
-10.2
1.5
46.5
43.8
128.0
ALA-131
SER-132
11.3
10.9
-9.3
4.5
86.7
83.2
-72.5
ALA-131
SER-132
11.3
10.9
-9.3
4.5
86.7
83.2
-72.5
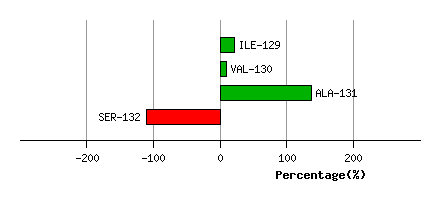
Graph shows rotational transition at bending residues and can be used
to identify hinge bending residues.
Probably only informative for interdomain rotations greater than 20 degrees
Residue
iResidue
i+1Distance of hinge axis to residue i in
(A) Distance of hinge axis to residue i in
(A) Change in
(deg) Change in
(deg) Angle of psi(i) axis to hinge axis
(deg) Angle of psi(i) axis to hinge axis
(deg) Percentage Progress
ALA-131
SER-132
11.3
10.9
-9.3
4.5
86.7
83.2
-72.5
ALA-131
SER-132
11.3
10.9
-9.3
4.5
86.7
83.2
-72.5
SER-132
ASP-133
12.3
12.3
46.1
-40.6
49.5
64.4
68.0
ASP-133
PRO-134
10.1
10.0
-8.4
12.1
112.8
114.8
232.8
PRO-134
GLN-135
7.5
7.5
-10.4
-3.6
108.0
101.9
-61.0
GLN-135
LYS-136
6.9
6.6
-5.8
6.2
36.8
34.8
26.9
LYS-136
TYR-137
6.9
6.7
10.6
-6.8
117.2
118.1
-49.4
TYR-137
LEU-138
4.2
4.1
-15.3
15.2
124.6
123.5
-41.2
LEU-138
LEU-139
1.9
1.8
-10.2
15.8
52.4
53.2
-50.3
LEU-139
LEU-140
5.0
5.1
10.1
-16.3
58.6
65.4
15.4
LEU-140
GLN-141
6.8
6.9
7.5
-17.5
74.9
76.8
24.7
GLN-141
GLN-142
10.4
10.4
3.6
-3.7
88.2
82.6
8.6
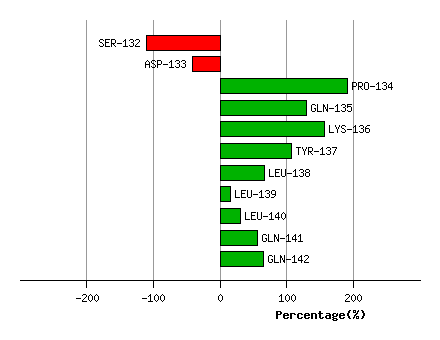
Graph shows rotational transition at bending residues and can be used
to identify hinge bending residues.
Probably only informative for interdomain rotations greater than 20 degrees