Gsy2p
(All numbering and residues are taken from first PDB file)
![]()
![]()
Bending Residue Dihedral Analysis
Residue
iResidue
i+1Distance of hinge axis to residue i in
(A) Distance of hinge axis to residue i in
(A) Change in
(deg) Change in
(deg) Angle of psi(i) axis to hinge axis
(deg) Angle of psi(i) axis to hinge axis
(deg) Percentage Progress
ARG-199
TYR-200
2.6
2.9
-7.5
0.7
154.2
154.2
-36.0
TYR-200
LEU-201
3.2
3.4
11.1
-4.0
68.5
67.0
32.7
LEU-201
CYS-202
1.3
0.8
-13.8
20.7
63.6
69.1
4.4
CYS-202
ALA-203
4.0
3.7
-15.6
13.0
96.9
107.5
-12.3
ALA-203
SER-204
6.2
5.9
-7.3
21.5
138.7
146.1
73.3
SER-204
GLY-205
7.2
6.2
118.6
118.1
89.5
94.1
-164.1
GLY-205
SER-206
9.0
7.8
142.8
51.1
123.2
38.8
299.6
SER-206
PHE-207
10.0
6.8
-52.1
-105.2
101.2
81.8
175.5
PHE-207
ASP-208
7.7
8.3
46.7
3.2
149.9
168.0
-386.8
ASP-208
PHE-209
10.1
10.0
8.0
3.4
114.6
110.6
8.7
PHE-209
TYR-210
7.4
7.1
8.5
-6.1
128.6
132.0
-23.7
TYR-210
ASN-211
9.6
9.2
-21.4
12.1
106.3
99.4
-21.9
ASN-211
CYS-212
12.8
12.6
18.7
-3.4
40.3
37.1
158.1
CYS-212
LEU-213
11.8
11.6
-33.6
9.0
93.7
99.5
-154.8
LEU-213
GLU-214
9.6
9.3
-6.5
4.4
103.2
107.3
-26.2
GLU-214
SER-215
13.1
12.6
-2.0
10.0
170.1
169.5
73.2
SER-215
VAL-216
12.0
12.2
-21.7
15.4
107.5
119.0
-10.6
VAL-216
ASP-217
8.9
9.0
9.9
-3.7
70.2
77.8
11.9
ASP-217
VAL-218
9.6
10.2
17.8
-7.4
114.8
109.4
-23.3
VAL-218
ASP-219
9.3
9.7
-5.4
10.8
123.5
130.7
34.9
ASP-219
HIS-220
10.7
11.2
-4.7
-19.1
130.4
129.9
-68.6
HIS-220
GLU-221
7.8
8.4
20.0
4.9
116.5
111.1
22.2
GLU-221
ALA-222
5.2
5.5
-2.2
1.4
70.0
71.0
30.8
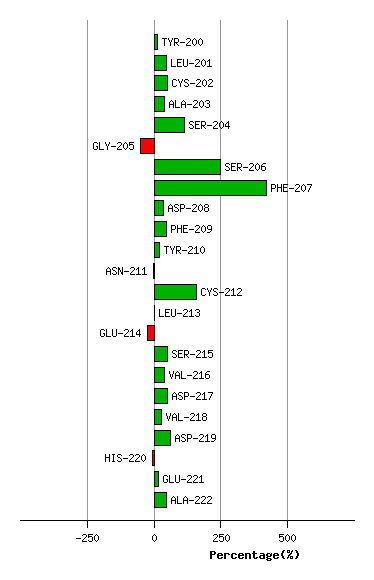
Graph shows rotational transition at bending residues and can be used
to identify hinge bending residues.
Probably only informative for interdomain rotations greater than 20 degrees
Residue
iResidue
i+1Distance of hinge axis to residue i in
(A) Distance of hinge axis to residue i in
(A) Change in
(deg) Change in
(deg) Angle of psi(i) axis to hinge axis
(deg) Angle of psi(i) axis to hinge axis
(deg) Percentage Progress
LEU-271
ASN-272
5.6
6.0
-3.9
16.6
27.6
26.7
-56.0
ASN-272
VAL-273
7.8
8.4
0.7
2.8
124.2
125.9
62.7
VAL-273
ILE-274
6.5
6.8
-0.5
-4.7
32.4
33.1
5.3
ILE-274
LYS-275
9.5
9.7
-16.0
10.2
57.0
47.3
35.7
LYS-275
PHE-276
8.4
8.2
-42.1
29.2
52.1
46.3
31.9
PHE-276
GLN-277
10.9
11.0
5.9
-3.9
156.5
154.8
-11.0
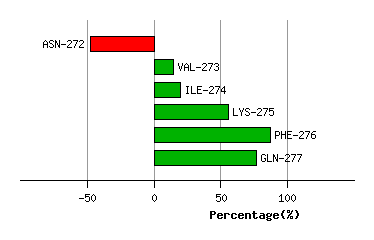
Graph shows rotational transition at bending residues and can be used
to identify hinge bending residues.
Probably only informative for interdomain rotations greater than 20 degrees
Residue
iResidue
i+1Distance of hinge axis to residue i in
(A) Distance of hinge axis to residue i in
(A) Change in
(deg) Change in
(deg) Angle of psi(i) axis to hinge axis
(deg) Angle of psi(i) axis to hinge axis
(deg) Percentage Progress
GLU-591
ARG-592
10.0
10.1
13.3
-2.2
68.4
63.8
38.2
ARG-592
LEU-593
8.2
8.4
2.4
-1.0
133.8
130.6
-13.9
LEU-593
SER-594
7.3
7.0
14.2
-3.1
105.3
99.1
-52.7
SER-594
ASP-595
5.1
4.6
-0.7
-3.3
115.3
110.1
2.8
ASP-595
LEU-596
2.5
1.9
-0.6
1.5
57.1
47.3
14.2
LEU-596
LEU-597
3.2
3.2
1.5
-17.8
135.9
136.5
73.0
LEU-597
ASP-598
0.4
0.5
18.0
-11.4
72.7
67.8
24.1
ASP-598
TRP-599
2.6
2.6
-11.5
4.6
72.8
71.2
9.7
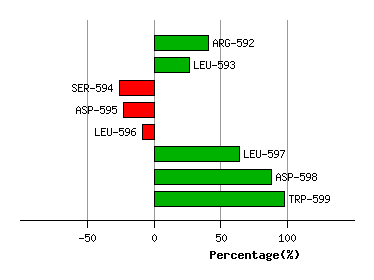
Graph shows rotational transition at bending residues and can be used
to identify hinge bending residues.
Probably only informative for interdomain rotations greater than 20 degrees